Curated OER
Profitable Soda Stand
Am I making any money? Help learners determine if their fictitious soda stand is turning a profit. They graph linear equations using the slope and y-intercept and identify the best price to use to sell soda. They identify the domain and...
Curated OER
Do These Systems Meet Your Expectations
This lesson is all about systems of equations and their graphs. Algebra learners create and solve systems of equation using tables and graphing. They identify the point of intersection of a system of equation, and discover what the...
Curated OER
Linear Graph
Students solve linear equations and graph the different functions. In this algebra lesson plan, students graph piecewise functions using the slope and y-intercept and the given restrictions on the domain of the line. They discuss rate of...
CK-12 Foundation
Input-Output Tables for Function Rules
How does changing a graph affect the function? Learners watch the changing input-output table as they adjust the location of the line graph. Questions prompt them to complete a table of values and determine the function rule.
Curated OER
More On Graphing Linear Equations
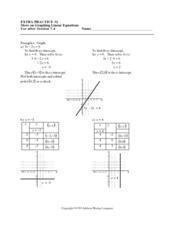
In this linear equation worksheet, students graph linear equations and identify the x or y-intercept. There are nine graphing equations on this two-page worksheet.
Curated OER
Pairs of Lines Multiple Choice
In this algebra worksheet, students identify the slope and y intercept of lines. They compare the slope of perpendicular and parallel lines and find the missing slope. There are 6 questions with an answer key.
Curated OER
Graphing Scatterplots
Students examine scatterplots and determine the equation of a line using the slope-intercept method. Students interpret graphs, draw inferences, and sketch a curve of best fit for the graph. Based upon patterns in the graphs, students...
Curated OER
Slope of a Line
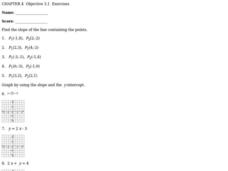
For this slope of a line worksheet, students solve ten problems determining the slope of points and an equation. First, they find the slope of the line containing the two points given in the first five problems. Then, students graph the...
Curated OER
Lines of Best Fit
Students determine if there is an associationm in a scatter plot of data. They analyze data through predictios, comparisons, and applications. Students calculate the line of best fit using a graphing calculator. They display data in...
Curated OER
Lines of Best Fit
Students explore the concept of line of best fit. In this line of best fit lesson, students find lines of best fit in examples about riding your bike home from school and dentistry. Students find two data points and find the line of best...
Curated OER
Linear Relationship
Young scholars use a graphing calculator to examine the association between the data points and equation of a linear relationship. They write equations in slope- intercept form. Answer key included.
Curated OER
Systems of Linear Equations - Standard Form
Students write systems of equations and find solutions to systems of equations. They explain how they determined their solutions to a system of equations and justify their solutions. In addition, they write equations in standard form and...
Teach Engineering
Forms of Linear Equations
Linear equations are all about form. The fifth part in a unit of nine works with the different equivalent forms of linear equations. Class members become familiar with each form by identifying key aspects, graphing, and converting from...
Curated OER
Algebra I: Linear Functions
Using rates from a rental car company, young mathematicians graph data, explore linear relationships, and discuss the role of slope and the y-intercept. This lesson plan allows for the discussion of independent and dependent variables,...
Curated OER
Compound Inequalities and Graphing
Put geometry skills to the test! Learners solve compound inequalities and then graph the inequalities on a coordinate plane using their geometric skills. They identify the slope and y-intercept in order to graph correctly. I like this...
Curated OER
Graphing Inequalities in Two Variables
This study guide is a great resource to help you present the steps to graphing linear inequalities. Show your class two different ways to graph an inequality and work on a real-world example together. The document could also be easily...
Curated OER
Graphing Systems of Inequalities
Solve equations and graph systems of inequalities. Designed as a instructional activity to reinforce these concepts, learners revisit shading and boundaries along with solving linear inequalities.
Willow Tree
Linear Relationships
There's just something special about lines in algebra. Introduce your classes to linear equations by analyzing the linear relationship. Young mathematicians use input/output pairs to determine the slope and the slope-intercept formula to...
Curated OER
Gra[hing Linear Equations
In this Algebra I worksheet, 9th graders use the slope and y-intercept to graph a linear equation and fill in a table with the coordinates of the five points plotted. The seven page worksheet contains fourteen problems. Answers are not...
Curated OER
Lines in the Coordinate Plane
Students graph lines in a coordinate plane. In this geometry lesson, students graph lines on a coordinate plane, and identify the slope. They classify the lines as parallel or perpendicular and write an equation of a given line.
Curated OER
Graphing Linear Equations
In this Algebra I worksheet, 9th graders write the equation of a line given the slope and the y-intercept and determine the equation of a line given the graph. The five page worksheet contains twenty-eight problems. Answers are not...
Curated OER
Investigating Linear Equations Using Graphing Calculator
Learners investigate linear equations using the Ti-Calculator. In this algebra lesson, students graph lines and identify the different quadrants on a coordinate plane. They identify ordered pairs used to plot lines.
Kenan Fellows
Math Made Simple as 1-2-3: Simplified Educational Approach to Algebra
Writing an equation of a line is as easy as m and b. A lesson plan presentation gives individuals different strategies for writing equations of lines. Some items provide a slope and a point while others provide two points. Whatever the...
Georgetown University
Cup-Activity: Writing Equations From Data
Determine how cup stacking relates to linear equations. Pupils stack cups and record the heights. Using the data collected, learners develop a linear equation that models the height. The scholars then interpret the slope and the...


