Curated OER
Calculate the Slope of a Line Using Two Points
Find that slope! This video does an excellent job of demonstrating how to use the slope formula to find the slope of a line using two points. The instructor first reviews the definition of slope of a line, then works three problems using...
Wordpress
Introduction to Exponential Functions
This lesson begins with a review of linear functions and segues nicely over its fifteen examples and problems into a deep study of exponential functions. Linear and exponential growth are compared in an investment task. Data tables are...
Charleston School District
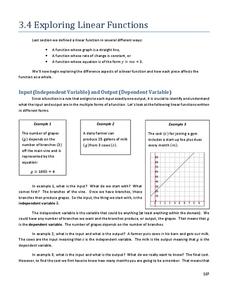
Exploring Linear Functions
What does a graph or equation say about a situation? Lots! The lesson uses the concepts explored in the previous four lessons in the series and applies them to problem solving situations. Learners create an equation from problems posed...
Curated OER
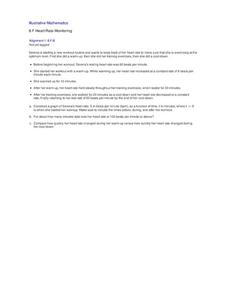
Heart Rate Monitoring
Algebra learners like this resource because it is easy to understand and it relates to their lives. Whether you are starting a new workout routine, or just climbing the stairs, your heart rate increases and decreases throughout the day....
Curated OER
Algebra 1 Worksheet
In this algebra worksheet, learners solve equations for y, graph the equations using the slope and y-intercept, and name four points on the line. There are 20 questions with their graphs.
Curated OER
The Intercepts of a Line
In this algebra worksheet, students calculate the slope and intercept of a line given an equation. There are 8 questions with an answer key.
Curated OER
Standard Linear Form
Ninth graders identify and describe the x-intercept as the place where the line crosses the x-axis as it applies to football. They create their own differentiations to reinforce the distinction between the x-intercept and the...
Curated OER
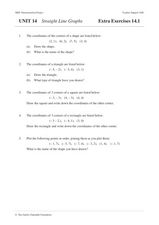
Straight Line Graphs
In this math worksheet, students plot lines on a graph paper when given the equation for the line in slope-intercept form. They tell the values of the slope and the y-intercept. Kids find the x and y intercepts and plot three lines....
Curated OER
The Slope of a Curve
Students graph the slopes of a line using the intercepts. In this precalculus lesson, students identify the properties of a curve slope. They find the limit and use a graping calculator to graph their lines.
Curated OER
Graphing Inequalities and Shading
Students graph and shade inequalities. In this algebra lesson, students graph inequalities using the slope-intercept form. They shade the side of the line that is the solution and identify the domain and range.
Curated OER
Solving Systems of Equations by graphing for Algebra One
Students watch the teacher demonstrate on an overhead projector how to graph various equations before the students try them on their own. They start with pencil and paper; once they grasp the concept they move on to punching in the...
Curated OER
Linear and Exponential Functions
This comprehensive unit on linear and exponential functions provides numerous clearly-written worksheets. Topics include graphing linear equations, solving systems of equations algebraically and by graphing, identifying the domain and...
Curated OER
Functions and Relations
In this functions and relations worksheet, 11th graders solve and complete 15 various types of problems. First, they find the slope and y-intercept for each function given. Then, students find the slope of the line passing through the...
Curated OER
Cockroach Slope
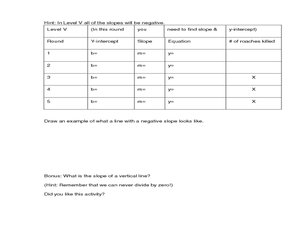
Students identify the slope of linear functions. In this slope lesson, students collect data and graph it. They write equations with no more than two variables and use technology to explain their data.
Curated OER
Linear Functions
In this linear function worksheet, students examine graphs and determine the slope, the y-intercept and the equation of a line. They identify parallel and perpendicular lines. This two-page worksheet contains 3 multi-step problems.
Curated OER
Graphing and the Coordinate Plane
Students examine the four quadrants of Cartesian coordinate plane. They play maze games and coordinate games to discover how to read and plot points on the plane. Students plot points on the coordinate plane and examine the ratio of...
Curated OER
Graph a Situation Without a Table
Students graph an equation without a table. In this algebra lesson, students are given rate or time and asked to graph a line at the starting rate. They use the slope intercept form to decipher the word problem and graph the line.
Curated OER
Equivalent Algebraic Equations
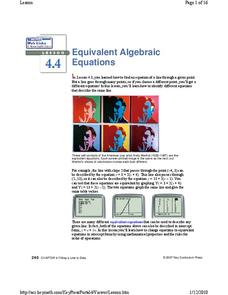
Ninth graders explore linear equations. In this Algebra I lesson, 9th graders investigate how different equivalent equations can be used to describe any given line. Students explore how to change equations to equivalents equations by...
Curated OER
Inverse of a Function
In this inverse of function instructional activity, 10th graders solve and graph 10 different problems that include graphically represented inverse functions. First, they solve each of the problems involving graphs and their inverses....
Curated OER
Line of Best Fit
Students identify the line of best fit. For this statistics lesson, students collect and analyze data. They calculate the regression equations and identify the different types of correlation.
Inside Mathematics
Squares and Circles
It's all about lines when going around. Pupils graph the relationship between the length of a side of a square and its perimeter. Class members explain the origin in context of the side length and perimeter. They compare the graph to the...
EngageNY
Interpreting Rate of Change and Initial Value
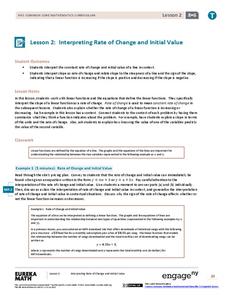
Building on knowledge from the previous lesson plan, the second lesson plan in this unit teaches scholars to identify and interpret rate of change and initial value of a linear function in context. They investigate how slope expresses...
EngageNY
Nature of Solutions of a System of Linear Equations
If at first you cannot graph, substitute. The lesson introduces the substitution method as a way to solve linear systems if the point of intersection is hard to determine from a graph. The 28th installment of a 33-part series finishes...
Shodor Education Foundation
Multiple Linear Regression
You'll have no regrets when you use the perfect lesson to teach regression! An interactive resource has individuals manipulate the slope and y-intercept of a line to match a set of data. Learners practice data sets with both positive and...


