Curated OER
Final Exam Review: College Algebra
In this final exam review instructional activity,s students solve systems of equations, polynomials and factor quadratic equations. They identify the slope of a line and write linear equations. Students use Cramer's rule, graphing,...
Curated OER
The Slope of a Line
Students define the slope of a line as rate of change. They investigate positive, negative, zero, or undefined slope using a graphing calculator. They determine the slope of a line when given the equation of the line.
Curated OER
Algebra I - Worksheet G12: Graphing Lines
In this graphing lines worksheet, high schoolers graph 28 lines given various data. Students graph lines given two points, a point and slope, and a line perpendicular or parallel to a point.
Curated OER
Review of Linear Graphing
Students graph linear equations. In this algebra lesson, students create tables from an equation and plot their points. They graph the equation using the slope and y-intercept. They rewrite word problems using linear equations to...
EngageNY
Characteristics of Parallel Lines
Systems of parallel lines have no solution. Pupils work examples to discover that lines with the same slope and different y-intercepts are parallel. The 27th segment of 33 uses this discovery to develop a proof, and the class determines...
Curated OER
Graphs and Functions
Middle schoolers describe plotting functions on the Cartesian coordinate plane. They solve functions on paper and using an online tool to plot points on a Cartesian coordinate plane creating lines and parabolas.
Curated OER
US Airports, Assessment Variation
Determining relationships is all part of algebra and functions. Your mathematicians will decide the type of relationship between airports and population and translate what the slope and y-intercept represent. The problem is multiple...
EngageNY
Interpreting Rate of Change and Initial Value
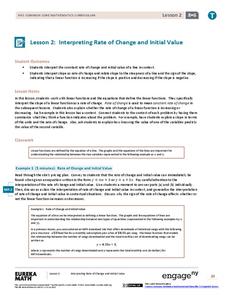
Building on knowledge from the previous lesson plan, the second lesson plan in this unit teaches scholars to identify and interpret rate of change and initial value of a linear function in context. They investigate how slope expresses...
Mt. San Antonio Collage
Test 1: Functions and Their Graphs
Save the time creating an assessment because these function problems should do the trick. With 10 multi-part questions, they each focus on a different topic including radical, polynomial, linear and piecewise functions. The majority of...
Curated OER
What's Its Slope
Young scholars identify the slope of a lines.In this algebra instructional activity, students define the meaning of slope and write an equation given the slope. They graph linear functions using the slope and y-intercept.
Curated OER
Graph Creator
Students rewrite equations using algebraic symbols. In this algebra lesson, students graph linear equations using the slope and y intercept. They make predictions about their graphs and analyze the results.
Raytheon
Equations and Graphing Review
In this equations and graphing review instructional activity, learners write, graph and solve equations for 62 problems, including a mid-unit review, with answers included.
Curated OER
An Exploration of the Slope of a Line
Students define the slope of a line. For this algebra lesson, students differentiate between parallel and perpendicular lines using their slopes. They rewrite equations in slope intercept form and explain the meaning of the slope.
Curated OER
The Slope of Parallel and Perpendicular Lines
In this Algebra I/Algebra II worksheet, students examine slope to determine if the given lines are parallel or perpendicular. Students determine the equation of lines that are either parallel or perpendicular to the given line. The two...
Curated OER
Equations and Inequalities
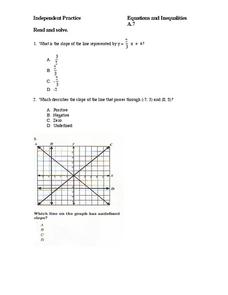
In this equations and inequalities worksheet, 9th graders solve and graph 10 different problems that include determine the slope of a line. First, they determine the slope of a line represented by a given equation. Then, students...
Curated OER
Equations and Inequalities
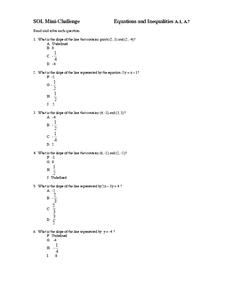
In this equations and inequalities worksheet, 9th graders solve and graph 10 different problems that include determining the slope of a line in each. First, they determine the line that contains given points on a grid. Then, students...
Curated OER
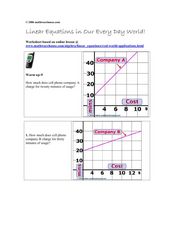
Linear Equations in Our Every Day World!
In this linear equations learning exercise, students read and interpret graphed linear equations. They read a story problem, write a linear equation, and plot the points on a coordinate plane. This five-page learning exercise cotnains...
Curated OER
Basic Algebra and Computers: Spreadsheets, Charts, and Simple Line Graphs
Students, while in the computer lab, assess how to use Microsoft Excel as a "graphing calculator." They view visual representations of line graphs in a Cartesian plane while incorporating basic skills for using Excel productively.
Curated OER
Integrals
In this integrals worksheet, learners solve and complete 22 different types of problems. First, they evaluate each of the listed integrals provided on the sheet. Then, students solve each of the differential equations. They also graph a...
Curated OER
Flight of Angles of Inclination
Students measure the flight of a gilder. In this fight of angles lesson, students explore the flight of a glider and measure the distance flown. They collect statistical data of the flights and determine the slope of each flight. ...
Alabama Learning Exchange
Investigating School Safety and Slope
Learners investigate the slope of various stairways through a "news report" approach and employ mathematical knowledge of applied slope to report on wheelchair accessibility and adherence to Americans with Disabilities Act. They...
Curated OER
Exploring Linear Equations: Student Worksheet
An activity around linear equations, slope, and intercept is here for you. In it, young mathematicians engage in a whole-class activity while the teacher uses the overhead projector graphing calculator. This activity also focuses on...
Virginia Department of Education
Transformationally Speaking
Young mathematicians explore transformations of graphs by graphing sets of functions on the same pair of axes. They use their graphs to determine the effect that the values of a and b in y = ax + b have on the graph of y = x.
Curated OER
Graphing 3 Ways
In this graphing learning exercise, students graph 10 equations using the following methods: slope-intercept form, x- and y-intercepts, or by using a table. Students check their work using a graphing calculator.


