Curated OER
Let's Go Slopey
Students create a table of values to graph a line. In this algebra lesson, students identify the slope and intercept of a linear equation. They use a Ticalculator to graph their function.
Curated OER
Graphing System of Equations
Students solve system of equation. In this algebra lesson, students graph, substitute and eliminate to solve system of equation. They identify the point of intersection and how many solution each system will have.
Curated OER
Graphing Data from the Chemistry Laboratory
Students graph and analyze data using a spreadsheet.
Curated OER
Introduction to Slope
Students distinguish between positive and negative slope. They calculate the slope of various lines. Students identify and generate perpendicular and parallel lines base on their slope.
Curated OER
Seven Advanced Algebra Problem Sets
For this advanced algebra worksheet, students solve seven problem sets covering: linear equations, arithmetic sequence, slope, point-slope, median, linear system, substitution method and the elimination method.
Curated OER
Race Track (Culminating Activity)
Students graph and solve linear equations. In this algebra lesson, students use the slope and y-intercept to graph lines. They relate lines to the real world using different applications.
Curated OER
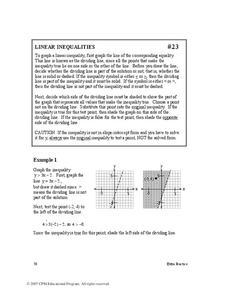
Linear Inequalities
In this linear inequalities worksheet, students solve and graph systems of inequalities on a coordinate plane. Examples and explanations are provided. This five-page worksheet contains 32 problems. Answers are provided at the end of...
Curated OER
Chapter 2 Practice Test
In this algebra activity, students examine and graph linear equation, inequalities, and absolute value inequalities in two variables. The three page activity contains forty-six problems. Answers are not included.
Curated OER
Graphing and the Coordinate Plane
Students learn about the Cartesian coordinate plane, understand the four quadrants of the Cartesian coordinate plane, and plot points on the plane. Students read coordinates for a point from a graph and give the ratio of rise over run...
Alabama Learning Exchange
Graphing Stations
Students explore the concept of graphing stations. In this graphing stations instructional activity, students head to various teacher set-up stations involving slope, point-slope, standard form, parallel lines, etc. Students work...
Curated OER
Race Car Activity
Students investigate linear functions. In this linear functions lesson, students are given a situation where two race cars start at the same point. Students have four graphs that they match to the race car scenario. Students describe...
Curated OER
More Complicated Functions: Introduction to Linear Functions
Students explore the concept of linear functions. For this linear functions lesson, students translate linear functions from tables to graphs to equations. Students use an applet to write a function rule for a linear function in...
Curated OER
Quadrants
In this quadrants worksheet, 10th graders solve and graph 6 different graphs that contain four different quadrants. They name the quadrant or on which axis the point lies. Students identify the difference between graphing positive and...
Curated OER
Chapter 3 Review
In this review worksheet, students read circle graphs and line graphs. They identify quadrants in a coordinate plane and match graphs to their appropriate linear equation. Students find the slope of a line and identify the y-intercept....
Curated OER
Expressing Geometric Properties with Equations
Algebra and geometry are not interchangeable. Demonstrate why not with a series of problems that deal with the equations of circles and equations of lines that meet specific criteria.
Del Mar College
Algebra Assessment Review
Jam packed with problems, this advanced Algebra worksheet focuses on topics such as domain, solving quadratics, solving rationals, and function notation.
Mathematics Vision Project
Linear and Exponential Functions
Provide a continuous progression to linear and exponential functions. Pupils continue to work with the discrete functions known as sequences to the broader linear and exponential functions. The second unit in a series of nine provides...
Curated OER
Points as solutions
Ninth graders graph linear functions using coordinate points. In this algebra lesson plan, 9th graders plot points and graph a line. They use the slope intercept form to graph their equation and evaluate points as solution to the function.
Curated OER
Graphing Linear Equations
In this math worksheet, students practice graphing the solutions to the linear equations. They pay special attention to the slope and y intercepts.
Curated OER
Linear and Exponential Functions
This comprehensive unit on linear and exponential functions provides numerous clearly-written worksheets. Topics include graphing linear equations, solving systems of equations algebraically and by graphing, identifying the domain and...
Curated OER
How Long Can You Go?
Eighth graders examine the usefulness of a line of best fit by collecting and graphing data, using a graphing calculator to determine the line of best fit, and making a variety of predictions. They watch a video, then design a...
Charleston School District
The Line of Best Fit
If it's warm, they will come! Learners find a line of best fit to show a relationship between temperature and beach visitors. Previous lessons in the series showed pupils how to create and find associations in scatter plots. Now, they...
Curated OER
Graphing Linear Equations
Ninth graders develop an understanding of and the applications for linear equations and their graphical displays. They participate in a cooperative learning activity of matching a graphic display with an equation.
Curated OER
EOC Review G
In this end of course review, students factor expressions, interpret statistic problems, and identify the maximum and minimum of equations. This two-page activity contains 5 multi-step problems.


