Mathematics Vision Project
Module 1: Functions and Their Inverses
Nothing better than the original! Help your class understand the relationship of an inverse function to its original function. Learners study the connection between the original function and its inverse through algebraic properties,...
Mathematics Vision Project
Module 4: Polynomial Functions
Bridge the gap between graphical and algebraic representations. Learners complete six lessons that begin by pointing out connections between the key features of a polynomial graph and its algebraic function. Later, pupils use the...
Illustrative Mathematics
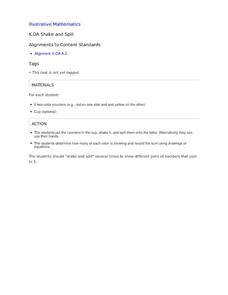
Shake and Spill
Entertaining as well as educational, this math activity about decomposing numbers is bound to capture the engagement of young learners. Given a cup and five two-color counters, young mathematicians simply shake and spill the cup,...
Rational Number Project
Initial Fraction Ideas: Lesson 3
Visual models support young mathematicians as they deepen their fractional number sense in this elementary math lesson. Using fraction circle manipulatives, children explore basic unit fractions as they develop the fundamental...
Charleston School District
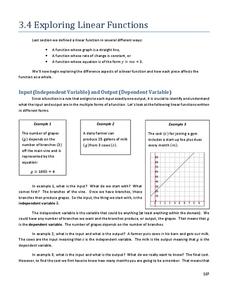
Exploring Linear Functions
What does a graph or equation say about a situation? Lots! The lesson uses the concepts explored in the previous four lessons in the series and applies them to problem solving situations. Learners create an equation from problems posed...
Illustrative Mathematics
Weather Graph Data
Teaching young mathematicians about collecting and analyzing data allows for a variety of fun and engaging activities. Here, children observe the weather every day for a month, recording their observations in the form of a bar graph....
Beyond Benign
House Project Overview
What does your perfect house look like? Pupils design a sustainable house given certain specifications. They create concept maps that detail the math skills they need to use while considering their designs.
CCSS Math Activities
Smarter Balanced Sample Items: High School Math – Target P
Learn how to show data in varied ways. A PowerPoint presentation provides six questions from the high school SBAC Claim 1 Target P item specifications. It covers creating data representations, interpreting and comparing data, and...
Virginia Department of Education
Exploring 3-D Geometry
Take young mathematicians on an exploration of the world of 3-D geometry with this seven-lesson unit. After first defining the terms perimeter, area, and volume and how they apply to the real world, students continue on to learn the...
Curated OER
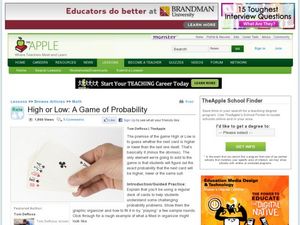
High or Low- Probability
Students use playing cards to examine probability. In this probability lesson plan, students work in groups with a deck of cards and predict if the next card they lay down will be high or low. Students fill out a graphic organizer with...
Chapman University
A Pythagorean-Style Proof of the Sine Sum-of-Angles Formula
This well organized poster shows a step-by-step algebraic proof and related graphic. Understanding how formulas were derived, connects learners to the idea that the study of mathematics is continuous and cumulative. Learners will also...
EngageNY
Choosing a Model
There's a function for that! Scholars examine real-world situations to determine which type of function would best model the data in the 23rd installment of a 35-part module. It involves considering the nature of the data in addition to...
EngageNY
Modeling with Quadratic Functions (part 1)
Relevance is key! The resource applies quadratic modeling by incorporating application of physics and business. Pupils work through scenarios of projectile motion and revenue/profit relationships. By using the key features of the graph,...
Chapman University
Graphs of the Sine and Cosine Function in Degrees
This bright, clear, graphic, display of the sin(x) and cos(x) functions spans the domain between -360 degrees and 360 degree. Use it as a poster, handout, presentation slide, or project it onto a whiteboard.
Chapman University
Graphs of the Sine and Cosine Function in Radians
This bright, clear, graphical display of the sin(x) and cos(x) functions spans the domain between -2 pi radians and 2 pi radians. Use it as a poster, handout, presentation slide, or project it onto a whiteboard.
Illustrative Mathematics
Roll & Build
Develop young mathematicians' understanding of place value with this hands-on math activity. Working in pairs, learners take turns building two-digit numbers by rolling two ten-sided dice. Base ten blocks are then used to model the...
Curated OER
Sort It Out
Elementary schoolers engage in a game of logical reasoning called Secret Sort. A Venn diagram is used as a way to sort objects. This resource would be a great way to introduce the Venn diagram (maybe the most famous, and most-useful...
Curated OER
Pricing Your Craft Worksheet
This cross-curricular activity could be used to teach economics, business, practical math, and more. Learners pretend they are craftspeople and choose a craft to market. Using a graphic organizer and provided models, class members...
Curated OER
Sharing or Grouping?
In division, word problems often help learners understand the application aspect of the math. By prompting them to label division problems as either grouping or sharing, this worksheet takes a less intimidating and more relatable...
Curated OER
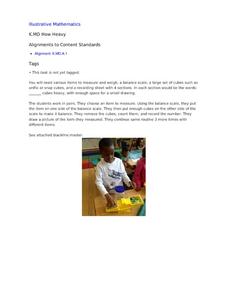
How Heavy
Break out the balances for this primary grade lesson on weight measurement. Using common elementary school manipulatives like unifix or snap cubes, young mathematicians determine the weight of four different classroom objects. A graphic...
Curated OER
Word Problem Solving Strategies Cookies 2
This is a fantastic template to guide scholars in solving math word problems! Students read a word problem dealing with sales and profits, and fill in a graphic organizer to guide the process. They consider important information, the...
Curated OER
Using Grams and Kilograms
Practice the metric system with this basic worksheet. Guided by a fun illustration of a mouse, students problem solve using a balance scale. Two graphic organizers allow them to record their findings in grams and kilograms.
Fuel the Brain
One Inch Scavenger Hunt
How many items can your learners find that are approximately one inch in length or width? Using this graphic organizer, they find nine, labeling and drawing each. A line that is 1-inch is provided at the bottom of the page, or you could...
Curated OER
Less and More Scavenger Hunt
Send your scholars on a measuring scavenger hunt with this interactive worksheet! They use a graphic organizer to record their findings as they search for items which are less than, more than, or just about one inch long. For each, they...


