Georgia Department of Education
Ga Virtual Learning: Chemistry: Introduction to Chemistry
This online course guides students through the scientific method with an emphasis on analyzing data and graphical analysis as a foundation to a chemistry course.
Texas Education Agency
Texas Gateway: Analyze Graphical Sources: Practice 2 (English I Reading)
This lesson focuses on practice exercises to understand and interpret the data in a graphic representations including pie charts, bar graphs, and line graphs.
US Environmental Protection Agency
Epa: Air Data
The AirData website gives you access to air quality data collected at outdoor monitors across the United States, Puerto Rico, and the U. S. Virgin Islands. The data comes primarily from the AQS (Air Quality System) database. You can...
Yale University
Yale University: Categorical Data Examples
Site provides some different examples of categorical data and discusses the use of two-way tables.
Texas Education Agency
Texas Gateway: Evaluating Data in Tables, Graphs and Charts
[Accessible by TX Educators. Free Registration/Login Required] In this lesson students look at examples of graphics, tables, charts, and graphs, and learn how to interpret their data. They will be able to use this skill to enhance their...
TeachEngineering
Teach Engineering: Program Analysis Using App Inventor
In computer science, program analysis is used to determine the behavior of computer programs. Flow charts are an important tool for understanding how programs work by tracing control flow. Control flow is a graphical representation of...
Association of Religion Data Archives
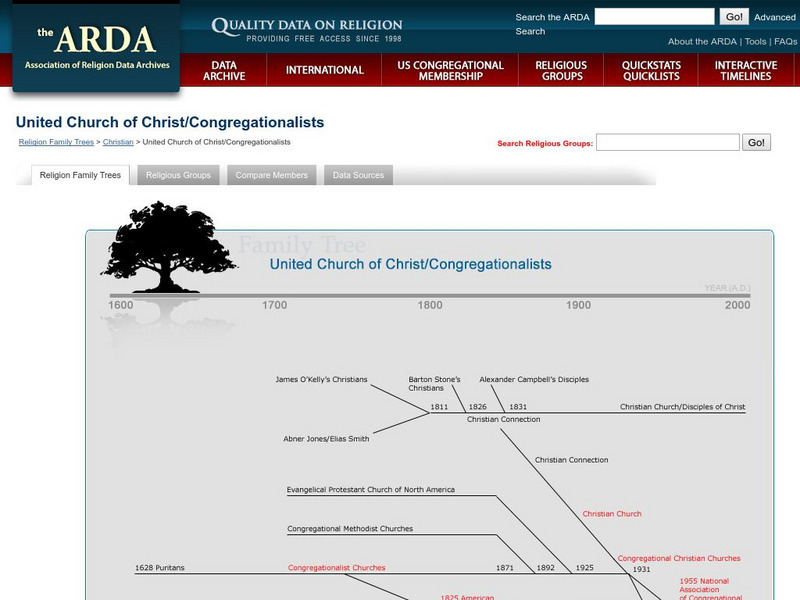
Association of Religion Data Archives: Denominational Family Tree: Congregationalists
A graphic representation giving the various religious sects and groups that make up the United Church of Christ/Congregationalists in the United States along with a timeline. Provides additional information on certain groups when you do...
Association of Religion Data Archives
Association of Religion Data Archives: Denominational Family Tree: Presbyterian Family
A graphic representation giving the various religious sects and groups that make up the Presbyterian church in the United States along with a timeline. Provides additional information on certain groups when you do a mouse-over.
Association of Religion Data Archives
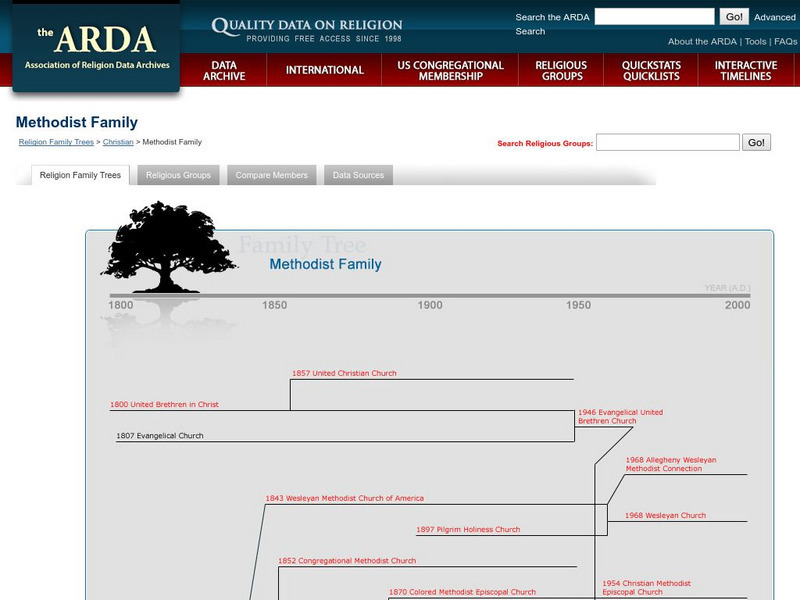
Association of Religion Data Archives: Family Tree: Methodist Church
A graphic representation giving the various religious sects and groups that make up the Methodist church in the United States along with a timeline. Provides additional information on certain groups when you do a mouse-over.
Association of Religion Data Archives
Association of Religion Data Archives: Family Tree: Mennonite Churches
A graphic representation giving the various religious sects and groups that make up the Mennonite churches in the United States along with a timeline. Provides additional information on certain groups when you do a mouse-over.
Association of Religion Data Archives
Association of Religion Data Archives: Family Tree: Lutheran Church
A graphic representation giving the various religious sects and groups that make up the Lutheran church in the United States along with a timeline. Provides additional information on certain groups when you do a mouse-over.
Association of Religion Data Archives
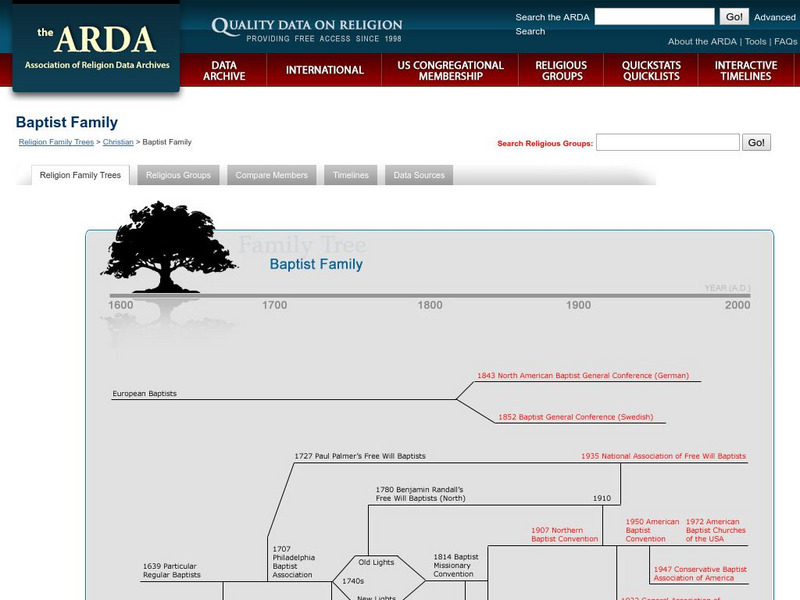
Association of Religion Data Archives: Family Tree: Baptist Church
A graphic representation giving the various religious sects and groups that make up the Baptist church in the United States along with a timeline. Provides additional information on certain groups when you do a mouse-over.
US Geological Survey
Usgs: Monterey Submarine Canyon, California Moored Array Data Report [Pdf]
This advanced site discusses some of the research done and research techniques used in studies of the Monterey Canyon. Great graphics showing the position of the canyon relative to other features of the continental margin. Also...
Texas Education Agency
Texas Gateway: Informational Text: Analyze Graphical Sources: Practice 2
[Accessible by TX Educators. Free Registration/Login Required] In this lesson, you will learn how to evaluate the clarity and visual appeal of images and other graphic elements included in a reading text. Practice exercises are included.
Texas Education Agency
Texas Gateway: Evaluate a Text for Its Graphics and Visual Appeal
This lesson will teach you how to evaluate texts for the clarity of their graphics and for their visual appeal.
Texas Education Agency
Texas Gateway: Analyze Graphical Sources: Practice 2 (English Ii Reading)
[Accessible by TX Educators. Free Registration/Login Required] Analyze the factual, quantitative, and technical data in graphs and charts.
Texas Education Agency
Texas Gateway: Analyze Graphical Sources: Practice 2 (English I Reading)
Analyze the factual, quantitative, and technical data in graphs and charts.
Other
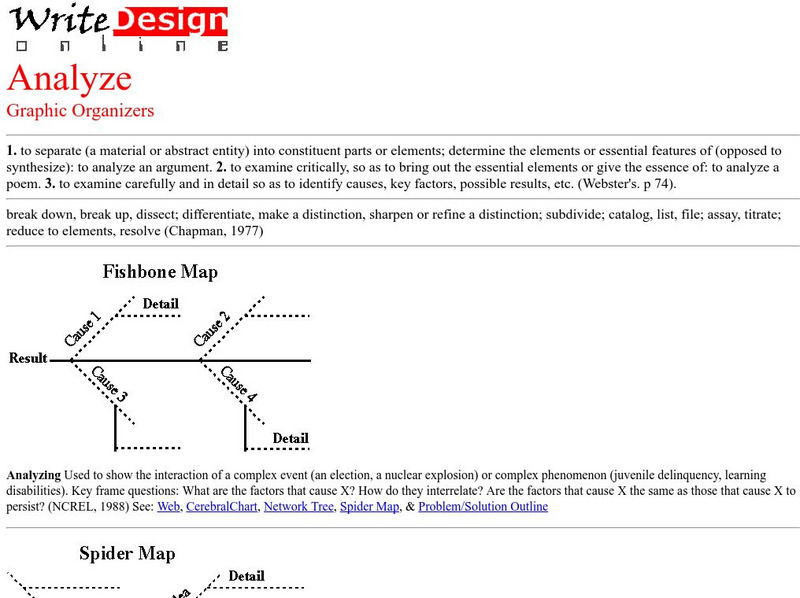
Write Design: Graphic Organizers: Analyze
Lists and describes several types of graphic organizers which fall under the "analysis" mold, including fishbone, spider maps, Venn Diagrams, and more.
Texas Instruments
Texas Instruments: Describing One Variable Data
Students sort data and display it graphically using various plots. They also get familiarized with statistical concepts like measures of spread and central tendency.
Houghton Mifflin Harcourt
Holt, Rinehart and Winston: Elements of Literature: Historical/biographical Analysis Chart [Pdf]
A short graphic organizer which allows students to assess the historical and biographical influence on a piece of literature.
Smithsonian Institution
Smithsonian Learning Lab: Teaching With Primary Sources
Five lesson plans, complete with videos, primary sources, and document-based questions (DBQ) to encourage students to utilize primary sources and incorporate thinking and writing into daily learning. Topics include: Artifact &...
Other
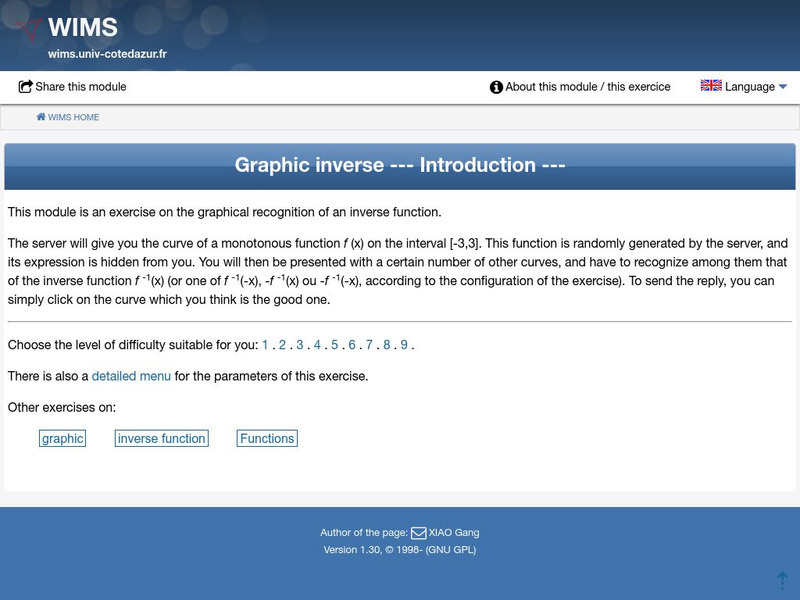
Universite De Nice Sophia Antipolis: Graphic Inverse
An introduction to the graphic inverse with many examples the student can work on-line.
University of South Florida
Fcat Express: Semantic Feature Analysis Worksheet [Pdf]
This is a worksheet in a pdf format on Semantic Feature Analysis. The worksheet, or matrix, is divided into boxes in three rows with four columns across.
University of Cambridge
University of Cambridge: Maths and Sports: Olympic Records
Can you work out which Olympics athletics event each anonymised graph of Olympic records data represents? This activity, aimed at Key Stage 3 (age 11-14), gives students the opportunity to make sense of graphical data and challenges them...







![Usgs: Monterey Submarine Canyon, California Moored Array Data Report [Pdf] Handout Usgs: Monterey Submarine Canyon, California Moored Array Data Report [Pdf] Handout](https://d15y2dacu3jp90.cloudfront.net/images/attachment_defaults/resource/large/FPO-knovation.png)

