Shodor Education Foundation
Sequencer
Take the first step into graphing sequences. Learners set the starting number, multiplier, add-on, and the number of steps for a sequence. Using the inputs, the interactive calculates and plots the sequence on the coordinate plane. Users...
Shodor Education Foundation
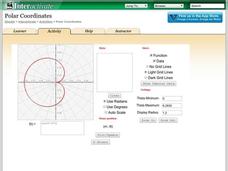
Polar Coordinates
Polar opposites might not work together—but polar coordinates do! The interactive provides learners the opportunity to graph trigonometric and algebraic functions using polar coordinates. The program takes either individual data points...
Curated OER
Weather
Students create a spreadsheet and chart using data collected. In this weather lesson, students select five cities from their state, including the city they live in. Students take daily temperature readings from all five cities. ...
Curated OER
Graphs
In this graphs worksheet, students solve and complete 9 various types of problems. First, they use a large scatter graph to complete a described trend in data. Then, students find the difference of negative numbers and place them in...
Curated OER
M & Ms in a Bag
Students make predictions about the number and colors of M&M's in a snack size package. They create an Excel spreadsheet to record the data from their small group's bag, create a graph of the data, and discuss the variations of data...
Curated OER
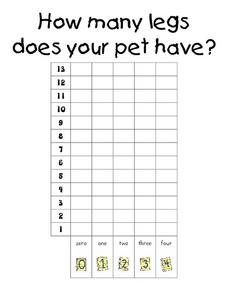
How Many Legs Does Your Pet Have?-- Class Bar Graph
For this math worksheet, students collaborate as a class to make a bar graph displaying how many legs the students' pets have. Results are plotted on the graph.
Curated OER
Graphs! Graphs! Graphs!
Students practice making charts and graphs from data on spreadsheets. Individually, they create a graph representing the latest information on voter registration. They answer questions and analyze the data to end the lesson.
West Contra Costa Unified School District
Writing Exponential Functions Based on Data
Give your class a concrete example of exponential growth and decay using this hands-on activity. These Algebra II lessons allow for the exploration of exponential growth and decay models, as well as the discovery of the patterns of each....
Curated OER
Jellybean Graphs
Second graders predict and graph data based on the color of jelly beans they think are in a handful. In this prediction lesson plan, 2nd graders will predict how many of each color jellybean are in a handful. Then they graph these...
Curated OER
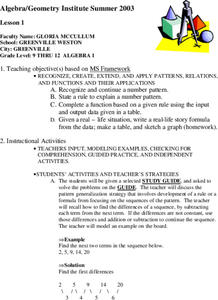
Patterns, Relations, and Functions
Young scholars investigate the patterns of different data sets of numbers. They use critical thinking skills in order to find the missing numbers in any given set. This lesson helps to develop the skill of number sense.
Curated OER
Math: Football Fever Fun
Students compile statistics from high school or other football team and construct a spreadsheet on which to record their findings. Using Chart Wizard to analyze the data, they construct charts and graphs for a visual display of the...
Curated OER
Graphing Favorite Fruit
Third graders take poll and sort data, enter the data to create a spreadsheet and create bar and pie graphs.
Curated OER
Which Graph is best?
Students use commercial software to organize and visually display data to draw conclusions; students use graphing software to create several types of graphs illustrating the number of each color of M&M's in one bag.
Saxon
Plotting Functions
Youngsters use a graphing calculator to assist in creating a function table. They graph the function on a coordinate plane. They explore the relationship between the domain and range in the graph. This four-page worksheet contains two...
Pennsylvania Department of Education
What is the Chance?
Fourth and fifth graders make predictions using data. In this analyzing data lesson, pupils use experimental data, frequency tables, and line plots to look for patterns in the data in order to determine chance. You will need to make a...
Willow Tree
Linear Relationships
There's just something special about lines in algebra. Introduce your classes to linear equations by analyzing the linear relationship. Young mathematicians use input/output pairs to determine the slope and the slope-intercept formula to...
Curated OER
Counting Coins
Second graders identify a quarter, dime, penny, nickel, and dime. They match the coin with it's monetary value, collect data on excel spreadsheet, and create a graph in Excel. Students participate in group activities.
Curated OER
Graphs Abound
Young scholars create a survey for their classmates to collect data on their favorite foods, eye color, pets or other categorical data. They compile the data from the survey in a table and then make a bar graph of each category using a...
Curated OER
Graphing Your Favorite Pizza Topping
Fifth graders can survey the students just in their classroom, the grade level, or other grade levels. Upon finishing the surveys and compiling the data, the students can input their results in an Excel template or create their own...
Curated OER
Worksheet 3.1 Functions
Middle and high schoolers complete and solve 12 various types of problems. First, they express the output as a function of the input in each table. Then, pupils evaluate for the given variable when the value is as stated. In addition,...
Curated OER
Using Excel to Draw a Best Fit Line
Students create line graphs for given data in Microsoft Excel. Students follow step by step instructions on how to create their graph, including how to create a trend line. Students print graphs without trend lines and manually draw...
Curated OER
Fly Away With Averages
Students discover the process of finding the mean, median, and mode. Through guided practice and problem solving activities, they use a computer program to input data and create a graph. Graph data is used to calculate the mean,...
Curated OER
Graphic Favorite Breakfast Foods
Second graders graph data based on a class survey of their favorite breakfast foods. In this graphing lesson plan, 2nd graders take a class survey of their favorite breakfast foods. Then they take that data and put it into a computer...
Curated OER
Gummy Bear Math
First graders predict, collect data, and create a graph based on gummy bear colors they are given. In this graphing lesson plan, 1st graders first predict how many colors of gummy bears there are. They then count the colors, graph them,...


