Curated OER
Matrix Operations
Students solve problems using matrices. In this algebra lesson, students add, subtract and multiply matrices. They use the graphing calculator to simplify and graph linear equations.
Curated OER
The X Factor - Trinomials and Algebra Tiles
Students use algebra tiles to identify the binomial factors and the graphing calculator to verify the result. In addition, they will identify the x-intercepts and y-intercepts of each trinomial function and explore relationships between...
Curated OER
Finding the Extrema Graphically and Symbolically
In this extrema worksheet, students use the first derivative test and the second derivative test to determine the local extrema. They identify the local maximum and global maximum. This eight-page worksheet contains detailed...
Curated OER
Pictograph to Bar Graph
Second graders explore organizing data to make it useful for interpreting picture graphs and bar graphs. They use Graphers software to create a pictograph and a bar graph.
Curated OER
Math & Social Science
Young scholars are given data and are to calculate averages and yearly totals of how many cars travel the Tacoma Narrows Bridge. They also make a graph of the data.
Curated OER
Timed Multiplication Test Graphs
Students use the tools of data analysis for managing information. They solve problems by generating, collecting, organizing, displaying histograms on bar graphs, circle graphs, line graphs, pictographs and charts. Students determine...
Curated OER
Using Averages to Create Graphs Through Excel
Sixth graders create and use a spreadsheet to make graphs which will be used to analyze Progress Report and Final Report Card grades. They practice finding the mean, median, mode, and range of a data set. Students also incorporate column...
Curated OER
Reading a Graph: Azimuth Range vs. Day in Barrow Alaska
High schoolers practice reading a graph while doing story problems. They determine the x and y intercepts and calculate the slope. They also practice writing linear equations.
Curated OER
Transformations and Exponential Functions
Tenth graders study graphing exponential functions. In this transformations lesson, 10th graders apply inquiry to determine how changes to a parent function affect its graph. Students analyze transformed graphs and generate the function...
Curated OER
Count The Letters
Students perform activities involving ratios, proportions and percents. Given a newspaper article, groups of students count the number of letters in a given area. They use calculators and data collected to construct a pie chart and bar...
Curated OER
Slope of Line
In this algebra worksheet, students calculate the slope of a line. They graph a linear equation given the slope and y-intercept and identify the slope and y-intercept given a linear graph. There are 15 questions.
Curated OER
Exponential Functions
In this exponential functions worksheet, 9th graders solve and complete 23 various types of problems. First, they simplify each expression. Then, students evaluate the function at different values of x and plot the ordered pairs. in...
Curated OER
Timed Caluculus Exam
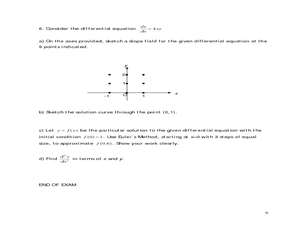
In this Calculus activity, 10th graders have 45 minuets to solve 6 multi-step problems involving velocity, integrals, and graphing.
Curated OER
Graphing Systems at the Races
Learners investigate systems of equations as they use the Ti-Navigator to explore scenarios about dog races and NASCAR races. Pupils determine the winner of the race and when opponents pass each other given a speed and distance.
Curated OER
Area Investigation
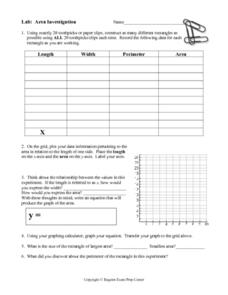
In this area investigation worksheet, 8th graders solve and complete 6 different problems that include complete a chart with given data and a graph. First, they construct as many different rectangles as possible using toothpicks. Then...
Curated OER
Linear Equation Experiments
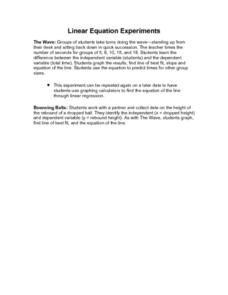
In this linear equation worksheet, learners solve and complete 2 different experiments that include using linear equations. First, they determine the difference between independent and dependent variables. Then, students graph their...
Curated OER
How Has Math Evolved?
Eighth graders pick a topic or person to research related to the history of mathematics. They brainstorm and create a concept map, using the multimedia software inspiration, about what they are researching and want to examine. They then...
Curated OER
Math: Currency Exchange Rates
Sixth graders apply the division and multiplication of decimals to convert dollars to various international currencies. In a travel simulation activity, they convert money, distance, and temperatures. During their "trip," students...
Bowland
Mystery Tours – Plan Your Tour
Everyone loves a vacation and a set of three activities has groups planning a tour of the U.K. using given distance, time, and price data. They solve a variety of problems related to the trip and produce a report on the success of the trip.
Bowland
Alien Invasion
Win the war of the worlds! Scholars solve a variety of problems related to an alien invasion. They determine where spaceships have landed on a coordinate map, devise a plan to avoid the aliens, observe the aliens, and break a code to...
EngageNY
Federal Income Tax
Introduce your class to the federal tax system through an algebraic lens. This resource asks pupils to examine the variable structure of the tax system based on income. Young accountants use equations, expressions, and inequalities to...
Curated OER
Pike Problems in Lake Davis
Pike fish pose a threat to native trout and catfish in lakes. Would you drain and poison a lake to get rid of the Pike fish? If the lake was drained and poisoned, then refilled and repopulated with trout and catfish, how would you...
California Education Partners
T Shirts
Which deal is best? Learners determine which of two companies has the best deal for a particular number of shirts. They begin by creating a table and equations containing each company's pricing structure. Individuals finish the seventh...
Curated OER
Mean, Median, Mode, etc.
Explore the concept of mean, median, and mode with pupils. They estimate the length of a string or the number of M&M's in a jar. Then find the mean, median, and mode of the class' estimates.


