Mathed Up!
Drawing Quadratic Graphs
Curve through the points. The resource, created as a review for the General Certificate of Secondary Education Math test, gives scholars the opportunity to refresh their quadratic graphing skills. Pupils fill out function tables to...
EngageNY
Revisiting the Graphs of the Trigonometric Functions
Use the graphs of the trigonometric functions to set the stage to inverse functions. The lesson reviews the graphs of the basic trigonometric functions and their transformations. Pupils use their knowledge of graphing functions to model...
Yummy Math
Playing with my calculator on the 4th of July
This fun activity guides learners through an exploration of the effects of replacing f(x) with -f(x), f(x) + c, k f(x), and f(x + c). Using graphing calculators, students experiment with variations of the graph of y = x^2 to design a...
Curated OER
What's in a Graph?
How many yellow Skittles® come in a fun-size package? Use candy color data to construct a bar graph and a pie chart. Pupils analyze bar graphs of real-life data on the Texas and Massachusetts populations. As an assessment at the end...
EngageNY
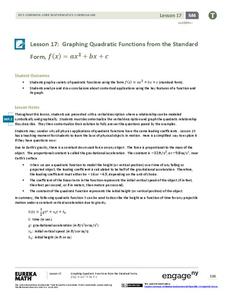
Graphing Quadratic Functions from the Standard Form
Use context to explain the importance of the key features of a graph. When context is introduced, the domain and range have meaning, which enhances understanding. Pupils use application questions to explore the key features of the graph...
CK-12 Foundation
Single Bar Graphs: Cupcakes
What is a little cake among friends? Given the relationship between the number of cupcakes five friends have, pupils create a bar graph. The learners answer questions about the graph and adjust the graph if one friend shares some of his...
Illustrative Mathematics
Graphing Rational Functions
The slider feature on Desmos excellently shows how graphs change based on different variable values. Learners look at two similar rational functions and compare and discuss what happens when the numbers go from positive to zero to...
Curated OER
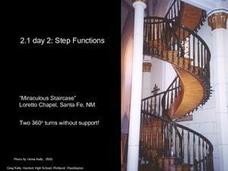
Calculus 2.1 day 2 - Step Functions
"Step functions" are sometimes used to describe real-life situations. This extensive lesson with many practice examples demonstrates two such functions: the Greatest Integer Function and the Least Integer Function. The commands on the...
Curated OER
Exploring Graphs
Students are introduced to connecting graphing in a coordinate plane to making scatterplots on a graphing calculator. Working in pairs, they connect points plotted to make a sailboat and complete questions on a worksheet as well as plot...
Curated OER
Probability Experiment Simulation: Design and Data Analysis Using a Graphing Calculator
Seventh graders simulate probability experiments. Using a graphing calculator, 7th graders design, conduct, and draw conclusions from simulations or probability experiments. Students construct frequency tables and compare the...
Curated OER
Graphing Calculator Activity: Multiplying and Dividing Mixed Numbers
For this graphing calculator worksheet, students explore necessary steps to multiply and divide mixed numbers using a graphing calculator. In groups, students measure objects in their classroom and write equations using their collected...
Curated OER
Three Methods for Using Quadratic Functions to Model Data
In this modeling data learning exercise, students use quadratic functions to model data using three different methods. This learning exercise provides explanations and an example. Additionally, students are given the steps to...
Curated OER
Domian and Range of Graphs
High schoolers determine the domain and range of various graphs using a graphing calculator. Given a set of graphs to analyze, learners calculate the range and domain of the graphs by plotting the graphs on their calculators. Downloads...
Inside Mathematics
Graphs (2006)
When told to describe a line, do your pupils list its color, length, and which side is high or low? Use a worksheet that engages scholars to properly label line graphs. It then requests two applied reasoning answers.
Curated OER
Exploring Quadratic Data : Transformation Graphing
High schoolers analyze the vertex form of a parabola and find an approximate fit of a model. They explain the quadratic parabola function and its properties by developing quadratic models. They use translation and dilation to change the...
Curated OER
When Will We Ever Use This? Predicting Using Graphs
Here are a set of graphing lessons that have a real-world business focus. Math skills include creating a scatter plot or line graph, fitting a line to a scatter plot, and making predictions. These lessons are aimed at an algebra 1...
EngageNY
Graphs of Quadratic Functions
How high is too high for a belly flop? Learners analyze data to model the world record belly flop using a quadratic equation. They create a graph and analyze the key features and apply them to the context of the video.
National Wildlife Federation
The Tide is High, but I’m Holding On… Using ICESat Data to Investigate Sea Level Rise
Based on the rate of melting observed from 2003-2007 in Greenland, it would take less than 10 minutes to fill the Dallas Cowboys' Stadium. The 17th lesson in a series of 21 has scholars use the ICESat data to understand the ice mass...
Wordpress
Introduction to Exponential Functions
This lesson plan begins with a review of linear functions and segues nicely over its fifteen examples and problems into a deep study of exponential functions. Linear and exponential growth are compared in an investment task. Data tables...
Kenan Fellows
Reading Airline Maintenance Graphs
Airline mechanics must be precise, or the consequences could be deadly. Their target ranges alter with changes in temperature and pressure. When preparing an airplane for flight, you must read a maintenance graph. The second lesson of...
Physics Classroom
Using Graphs
Many university professors complain incoming scholars struggle with interpreting graphs. A skill builder offers three different types of exercises including calculating slope, interpreting graphs, and extrapolating outside the plotted...
Curated OER
Number Line: Negative Numbers
In this graphing calculator learning exercise for the TI-83 calculator, students first observe a demonstration for calculating negative numbers. Next, students use their graphing calculator to answer 6 thoughtful T/F and short answer...
EngageNY
Modeling a Context from Data (part 2)
Forgive me, I regress. Building upon previous modeling activities, the class examines models using the regression function on a graphing calculator. They use the modeling process to interpret the context and to make predictions...
Curated OER
The Coordinate Plane
Use this Saxon math coordinate plane learning exercise to have your learners utilize a graphing calculator, equate the vertices of a rectangle, and then graph their conclusions as well as answer a variety of fill in the blank equations.


