Beyond Benign
Municipal Waste Generation
Statistically, waste may become a problem in the future if people do not take action. Using their knowledge of statistics and data representation, pupils take a look at the idea of waste generation. The four-part unit has class members...
Teach Engineering
Mechanics of Elastic Solids
Make the connection between Hooke's law and elasticity with an activity that introduces the class to the behavior of elastic materials. The resource defines stress and strain to calculate the modules of elasticity of...
Illustrative Mathematics
Identifying Quadratic Functions (Vertex Form)
Pupils calculate the equation of a quadratic in vertex form from a specific graph and determine an equation that would fit the description of a parabola. The final question determines the individuals' understanding of the signs of the...
Illustrative Mathematics
Graphs of Quadratic Functions
Instead of the typical quadratic questioning, explore the function and look at the three different ways a parabola can be written. The main task is when given several clues, young mathematicians must write an equation that matches the...
Mathed Up!
Inequalities Regions
Discover how to solve systems of inequalities by graphing. An informative video shows pupils how to determine the solution set after graphing each inequality of a system. To finish, a activity gives them a chance to practice this skill.
EngageNY
The Computation of the Slope of a Non-Vertical Line
Determine the slope when the unit rate is difficult to see. The 17th part of a 33-part series presents a situation that calls for a method to calculate the slope for any two points. It provides examples when the slope is hard to...
Balanced Assessment
Pizza Toppings
Pupils work with a pizza shop's menu to determine the total number of pizzas possible from their ingredient list, how much the pizzas would cost, and how long it would take to eat all of them. The assessment concludes by having scholars...
PBL Pathways
Death Project
Verify the rule of thumb for finding the time of death. The project-based learning task asks pupils to determine when the rule of thumb process of finding the time of death is appropriate. Learners develop a function for the rule and...
Curated OER
Matchstick Math: Using Manipulatives to Model Linear, Quadratic, and Exponential Functions
Playing with matches (unlit, of course) becomes an engaging learning experience in this fun instructional unit. Teach pupils how to apply properties of exponential functions to solve problems. They differentiate between quadratic and...
CK-12 Foundation
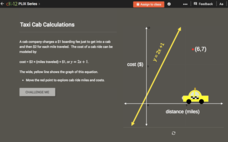
Checking Solutions to Equations: Taxi Cab Calculations
Ride to success in checking solutions to equations. Scholars use an interactive graph to identify points that are solutions to a linear equation. Interpreting these points in terms of the context completes the activity.
Curated OER
Temperature Bar Graph
Students explore mean, median and mode. In this math lesson, students analyze temperature data and figure the mean, median, and mode of the data. Students graph the data in a bar graph.
Curated OER
Census Statistics and Graphing
Learners graphically represent data from the Census. In this middle school mathematics lesson, students investigate the housing characteristics of different tribes of Native Americans and compare them to the average American...
Curated OER
Mean, Mode and Bar Graphs
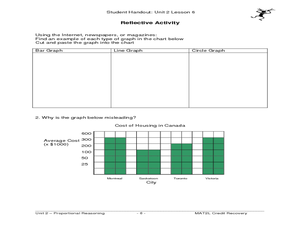
In this mean, mode and bar graphs worksheet, 5th graders analyze the data given, then answer three questions about a bar graph and the data shown.
Curated OER
Box Plots on the TI-83 Calculator
Eighth graders research box plots on the Internet. They gather real life statistics and analyze the collected statistics by making multiple box plots on the TI-83 calculator.
Curated OER
Linear Graphs and Equations
In this linear graphs and equations worksheet, students examine points on a graph and identify coordinates plotted on the point. Students determine the slope of a line and write the equation of a line. This three-page worksheet contains...
Curated OER
The Circle Graph
In this circle graph activity, students complete problems involving many circle graphs including a compass rose, degrees, and more. Students complete 7 activities.
Curated OER
Graph Your Motion
Students graph their linear equations. In this algebra lesson, students examine their lines and relate it to the slope or rate of change. They relate the steepness of the line to the slope being positive, negative or zero.
Curated OER
Seized Before Flights: Graph
In this bar graph worksheet, students analyze a graph that show the number of prohibited items intercepted at U.S. airport screening checkpoints. Students answer 3 problem solving questions about the data on the graph.
Curated OER
Graphing Quadratic Functions
Pupils explore quadratic functions in this algebra lesson. They investigate transformation of quadratic functions using the TI calculator. They use the vertex form for this lesson.
Curated OER
More graphing situations by making a table
Students make a table and graph plotting points. In this algebra lesson plan, students graph linear equations on a coordinate plane. They calculate the rate of change and analyze the graph for extrapolation.
Curated OER
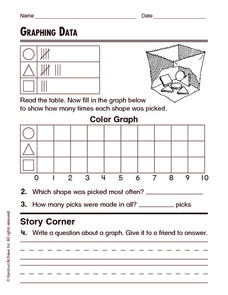
Graphing Data
In this graphing data worksheet, students solve and complete 8 different word problems related to graphing data given. First, they determine the percent of people who do not believe in any of the phenomena described and explain. Then,...
Curated OER
Graphing and Interpreting Linear Equations in Two Variables
Graph linear equations using a table of values. Learners solve equations in two variables using standard form of an equation. They identify the relationship between x and y values.
Curated OER
Digger and the Gang
Help online friends Digger and Sprat from the BBC series to solve math problems! In a series of activities, your class will use data sets to calculate measurements, averages, means, and probabilities. The class completes worksheets and...


