Texas Instruments
Function Notation - Texas Instruments
Using a TI-Nspire calculator, learners will work to better understand function notation and input/output functions. They write equations with a function symbols, identify what makes an equation a function, and graph lines in order to...
Curated OER
Making Connections: Matrices, Graph, Linear Systems
In this set of activities, matrices and equations are explored. They work with matrices using pen and paper as well as graphing calculator. Additionally real-world problems are explored.
Curated OER
Linear Regression on TI-82
In this linear regression worksheet, students graph linear regression problems using the TI-82 calculator. Instructions for using the calculator are provided. This two-page worksheet contains six problems.
Curated OER
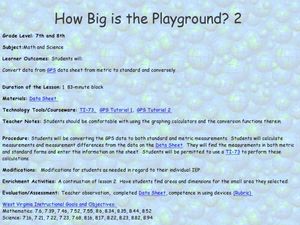
How Big Is The Playground?
Students calculate the standard and metric measurements of a playground. In this measurement instructional activity, students use GPS coordinates and graphing calculators to determine the dimensions of an area outside of the school in...
Curated OER
Move My Way: A CBR Analysis of Rates of Change
Learners match a given velocity graph and sketch the corresponding position graph using a graphing calculator. After collecting data from their everyday life, high schoolers use specific functions on their calculators to create graphs...
Curated OER
Lines, Lines, Everywhere
Students explore linear equation suing real life scenarios. In this algebra lesson plan, students find the slope and intercept of a line. They create table of values to plot their graph and draw conclusions.
Curated OER
Solving Systems of Equations
Learners explore the concept of solving systems of equations with two equations and two unknowns. In this solving systems of equations lesson, they work through problems of solving systems by substitution, elimination, and graphing....
Curated OER
Graphing and Interpreting Linear Equations in Two Variables
Graph linear equations using a table of values. Learners solve equations in two variables using standard form of an equation. They identify the relationship between x and y values.
Curated OER
Plugging Into The Best Price
Examine data and graph solutions on a coordinate plane with this algebra lesson plan. Young problem-solvers identify the effect of the slope on the steepness of the line. They use the TI to graph and analyze linear equations.
Curated OER
Diffusion & Osmosis with Data Analysis
Young scholars explore principles governing diffusion and osmosis. Students perform a dialysis tubing experiment. They obtain core samples of potato in varying concentrations of sugar-water to measure water potential of the potato...
Curated OER
Tune...Um!
High schoolers collect real data on sound. In this algebra lesson plan, students use a CBL and graphing calculator to observe the graph created by sound waves. They draw conclusion about the frequency of sound from the graph.
Curated OER
SHHH It's a Secret
Students rewrite word problems using expressions and equations. In this algebra lesson, students use the correct variable to solve and write equations. They use the TI to graph their solution.
Curated OER
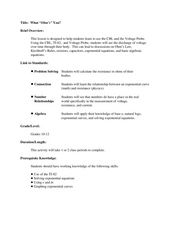
What "Ohm's" You?
Students use the CBL and voltage probe to observe electricity. In this algebra instructional activity, students use the TI calculator with the CBL to explore Ohm's Law. They discuss exponential equations and how it relates to...
Curated OER
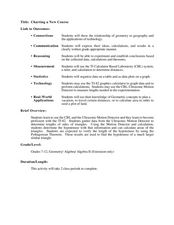
Charting a New Course
Students calculate the distance they will travel. In this geometry lesson, students use the TI and CBL system to make calculation of a certain path. They explore geography by calculating distances between different areas as it relates to...
Curated OER
Let's Go Slopey
Pupils create a table of values to graph a line. For this algebra lesson, students identify the slope and intercept of a linear equation. They use a Ticalculator to graph their function.
Curated OER
Walking on Air
Students collect and analyze data with a graph. In this statistics lesson, students use central tendencies to find the meaning of their data. They display the data on a Ti calculator.
Curated OER
How High Are the Clouds?
Students analyze height and collect data to create a graph. For this statistics lesson, students use central tendencies to analyze their data and make predictions. They apply concept of statistics to other areas of academics to make a...
Curated OER
Mathematical Analysis of Temperature Scales
Students use the point-slope formula to determine the relationship between the Celsius and Fahrenheit scales of temperature. They use a graphing calculator to determine the slope of the line between two points in each scale.
Curated OER
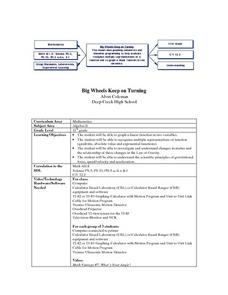
Big Wheels Keep on Turning
Eleventh graders work in groups and investigate how force determines the speed and distance then they view the video, "Math Vantage #7: What's Your Angle?." They are given a real life problem to solve using speed, ramps, angle, incline...
Curated OER
Worksheet #2.6: MT-A141 PreCalculus
For this graphing worksheet, students predict how a graph of given functions will work. Next, they check their work using a graphing calculator. Students use algebra to complete the graph of a square and determine transformations.
Curated OER
Worksheet 2.4/2.5: MT-A141 PreCalculus
In this precalculus worksheet, students use their graphing calculator to graph the domain and range of given terms. They write parametric equations and identify the coordinates of the points on the relation given certain terms.
Curated OER
Round and Round and Round We Go!
Students investigate motion using a CBL. For this algebra lesson, students collect and graph data on a coordinate plane. They define and identify amplitude and period of conic graphs.
Curated OER
Visual Representation of Reduced Fat
Students demonstrate their understanding of the Five-Number Summary and Box-Plots by analyzing different nutrition labels from regular and reduced fat items using graphing calculators.
Curated OER
Speaking Parametrically
Students solve equations by taking the derivative. In this calculus lesson, students solve parametric equations implicitly. They use the TI-calculator to graph their equations.


