Curated OER
Exploring Linear Equations: Student Worksheet
An activity around linear equations, slope, and intercept is here for you. In it, young mathematicians engage in a whole-class activity while the teacher uses the overhead projector graphing calculator. This activity also focuses on...
Curated OER
How's The Weather?
Students make a box and whiskers plot using the TI-73 graphing calculator. Each student would have their own calculator but they would work in small groups of two or three to help each other enter the data and make the plots.
Curated OER
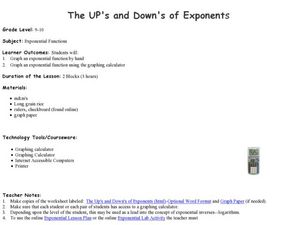
The UP's and Down's of Exponents
Students explore the concept of exponents. In this exponential functions worksheet, students complete provided worksheets that require them to graph exponential functions by hand as well using graphing calculators.
Virginia Department of Education
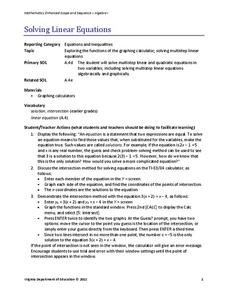
Solving Linear Equations
Practice solving linear equations by graphing. Scholars learn to solve multi-step linear equations in one variable by graphing both sides of the equation separately. They use graphing calculators to find the intersection of the graphs.
Curated OER
Exploring Transformations with Matrices
A page right out of the Holt Geometry book. Use a graphing calculator and graph paper to explore transformations with matrices.
Curated OER
Coming to Know F and C
Students collect temperatures using a probe and examine data. In this temperature lesson students complete an activity using a graphing calculator.
Curated OER
Height versus Shoe Size
Middle schoolers find a correlation between a person's height and his/her shoe size. They have access to entering data into lists on a graphing calculator and can complete scatter plots. Students read and interpret a scatter plot and use...
Curated OER
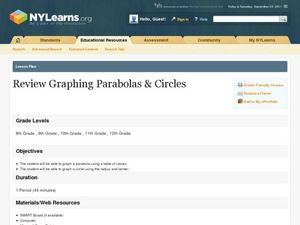
Graphing Parabolas and Circles
Students graph parabolas and circles. In this algebra lesson, students create a table of values and graph the coordinate pairs to create a graph. They graph a circle using the radius and center.
Curated OER
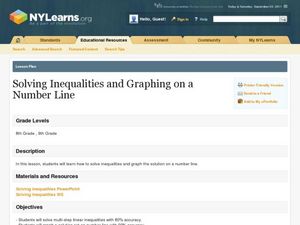
Solving Inequalities and Graphing
Students solve and graph inequalities on a number line. In this algebra lesson, students solve using addition, subtraction, multiplication and division and graph their solutions using open or closed circles. They graph with 80%-90%...
Curated OER
Graphing Linear Equations Using the Table Method
Students graph linear equations using a table. In this algebra lesson, students create a table of values using the linear equation to find the y-values. They plot their point on a coordinate plane and graph the line.
Curated OER
Graphs of the Sine and Cosine Function
In this college level Pre-Calculus worksheet, students investigate the graphs of the sine and cosine functions. The six page worksheet contains seventy-eight problems. Solutions are not provided.
Curated OER
Distance Calculations
Students calculate the distance between two points. In this geometry lesson, students use coordinates and the distance formula to find the distance. They perform an interactive lesson to solve the missing length.
Curated OER
Match The Graph Circles
High Schoolers engage in a study of circles and graphs that are related with the focus upon finding the center and radius. The lesson includes the suggestion of giving homework using circle problems before this one to create background...
Curated OER
Graphing Integers
Fifth graders explore the math concept of graphing integers. In this graphing integers lesson, 5th graders examine visual examples. Students also practice solving problems that their instructors model.
Curated OER
Student Costs Graph
Students calculate the mileage, gasoline costs, and travel time and costs for a vacation. They conduct a virtual field trip, and create a comparison graph of costs using Microsoft Excel software.
Curated OER
Rational Expressions Test with a Calculator
In this rational expression worksheet, students graph rational equations, evaluate limits, state intercepts, asymptotes, and roots and factor. This worksheet is designed as a test to be completed with a calculator.
Curated OER
Limits with a Calculator
Young scholars investigate Limits using a graphing calculator or TI. In this calculus lesson, students solve limit problems through modeling and relation to the real world. They use correct notation and solve problems involving more than...
Curated OER
Graphing With RXTE
High schoolers use data from the Rossi X-ray Tiiming Explorer (RXTE) satellite to analyze and graph.
Texas Instruments
Let's Play Ball with Families of Graphs
Learners explore quadratic equations in this Algebra II lesson. They investigate families of quadratic functions by graphing the parent function and family members on the same graph. Additionally, they write the equation of the parabola...
Curated OER
Unit 8 - Statistical Diagrams
In this statistical diagrams worksheet, high schoolers solve 30 short answer problems. Students find the mean of a set of numbers and read/interpret a graph to answer questions. High schoolers determine the x-values that satisfy a...
Curated OER
Sign of the Derivative
Learn how to investigate the change in a graph by dragging the cursor to observe the change in the function. They use the TI calculator to graph their parabola.
Curated OER
Graphing Linear Functions
For this linear functions worksheet, 9th graders solve and complete 30 different multiple choice problems that include graphing. First, they determine the expression that is equivalent to the given expression. Then, students determine...
Curated OER
Dog Days or Dog Years?
In need of some algebraic fun with real world implications?Learners use ordered pairs, a table of values and a scatter plot to evaluate the validity of several real world data sets. The class focuses on dog ages in human years, domain,...
Curated OER
Exponential vs. Power
Pupils differentiate between exponential and power functions. They identify the base, exponent and properties of exponential functions. They also graph the functions using the TI calculator.


