Curated OER
Worksheet 2.4/2.5: MT-A141 PreCalculus
For this precalculus worksheet, students use their graphing calculator to graph the domain and range of given terms. They write parametric equations and identify the coordinates of the points on the relation given certain terms.
Curated OER
Worksheet #2.6: MT-A141 PreCalculus
In this graphing worksheet, students predict how a graph of given functions will work. Next, they check their work using a graphing calculator. Students use algebra to complete the graph of a square and determine transformations.
Curated OER
Worksheet #2.1 PreCalculus Functions
For this precalculus worksheet, students use their graphing calculator to solve equations by finding the graph of an equation and by defining the function. Afterward, they explain the two methods used in solving the problem.
Curated OER
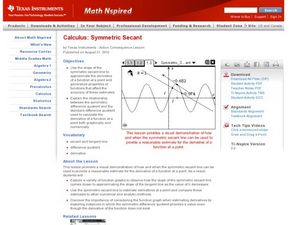
Symmetric Secant
Mathematicians use a symmetric secant line to prove the derivative at a point. In this trigonometry activity, students create secant lines on the navigator to analyze the derivative. They move the lines around and make observations.
Curated OER
Exploring Complex Roots
In exploring the concept of complex roots, students find the axis of symmetry and roots of parabolas. Then, they discuss what makes a solution complex and how to identify functions with complex roots.
Curated OER
Graphing Linear Equations
Ninth graders develop an understanding of and the applications for linear equations and their graphical displays. They participate in a cooperative learning activity of matching a graphic display with an equation.
Curated OER
Plotting Data Tables
Learners make a table and plot their data on a graph. In this algebra lesson, students graph piecewise functions using the given equations along with the restricted domain. They calculate the rate of change.
Curated OER
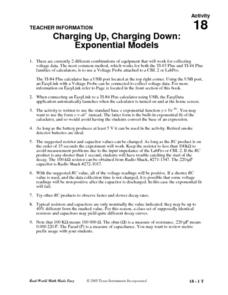
Charging Up, Charging Down
Learners collect and analyze voltage data. Then, they investigate exponential functions using the TI and a Voltage Probe and graph their data and analyze it using a table.
Curated OER
Garden Grid
Basically, your class reads about different garden plants from an included handout and seed packets that you provide, and then uses a grid to plan out where to place the plants. They can practice counting with the seeds, grouping,...
Texas Instruments
Math TODAY for TI-Navigator System - Is Leisure Time Really Shrinking?
High schoolers organize data from the USA TODAY Snapshot, "Is leisure time really shrinking?" into two scatter plots and determine the quadratic model for each scatter plot. They determine if these graphs intersect and learn the concept...
Curated OER
Equal Parts
In this equal parts worksheet, students, working with a partner, study, formulate and calculate the answers to six word problems or drawings.
Curated OER
Exploration of Trigonometry
Learners explore how changing an angle in a triangle changes the ratio of the sides. They also explore how changing the sides can make changes to an angle in a triangle. Finally, they determine how two different pairs of sides, in the...
Curated OER
Classy Fractions
In this fractions worksheet, students find the total numbers of students in their class and ask each student 7 questions provided. Students make a tally chart to record the responses and calculate the fraction of the class that answered...
Curated OER
Regressive Music
Student use the Ti calculator to graph sinusoidal graphs. In this calculus lesson, high schoolers use the CBL to collect and analyze data of sinusoidal graphs. They manipulate their collected data and make predictions.
Curated OER
Statistics
High schoolers log their computer usage hours. They determine the mean, median, mode and standard deviation of the collected data. They make a frequency histogram of the grouped data, both on graph paper, and on the TI 83+ graphing...
Curated OER
Between The Extremes
Students analyze graphs for specific properties. In this algebra lesson, students solve equations and graph using the TI calculator. They find the different changes that occur in each graph,including maximum and minimum.
Curated OER
Round and Round and Round We Go!
Students investigate motion using a CBL. For this algebra lesson, students collect and graph data on a coordinate plane. They define and identify amplitude and period of conic graphs.
Curated OER
Collecting And Fitting Quadratic Data
Students investigate the concept of using quadratic data to plot coordinates on a plane. They also apply the quadratic formula for a variety of problems with the help of a graphing calculator to draw the parabola for given coordinates.
Curated OER
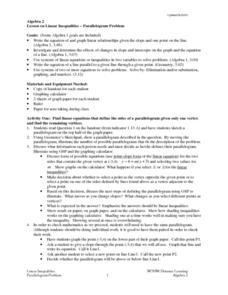
Linear Inequalities - Parallelogram Problem
Students use the Geometer's Sketchpad to illustrate possible answers to a parallelogram problem. As a class, they discuss the point-slope and linear equation forms. Individually, students solve their equations and check the results on...
Curated OER
A Cylinder Workshop
Students work with given formulas to solve for specific variables. The calculation of the volume of a cylinder and the change in volume when there is a constant surface area is analyzed in this lesson plan.
Curated OER
The Kangaroo Conundrum: A Study of a Quadratic Function
Students play a game and collect data for their graph. In this algebra instructional activity, students solve quadratic equations and identify properties of their graph. They describe the pattern created by the graph and the game.
Curated OER
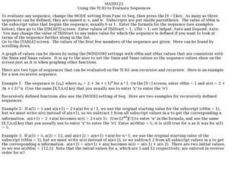
Using the TI-83 to Evaluate Sequences
In this evaluating sequences activity, learners use the TI-83 graphing calculator to evaluate sequences. Instructions on how to use the calculator with these type of problems is provided. There are three problems on this one-page...
Curated OER
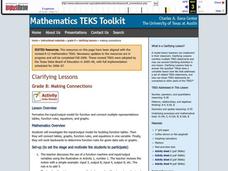
Making Connections
Eighth graders investigate the input/output model for building function tables. From the data, 8th graders connect tables, graphs, function rules, and equations in one variable. They work backwards to determine function rules for given...
Curated OER
Polar Equations
In this precalculus worksheet, students find the solutions to polar equations for the 3 detailed problems using the coordinates and graphing calculators.


