Virginia Department of Education
Mathematics Vocabulary Cards - Kindergarten
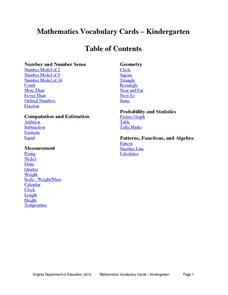
Enhance your math lesson with a series of pictures that illustrate different math concepts. The vocabulary includes a variety of ideas and pictures including fractions, ordinal numbers, picture graphs, and number lines.
Virginia Department of Education
Molar Volume of a Gas
What is a chemist's favorite plant? Stoichiome Tree! Scholars produce hydrogen gas by reacting magnesium with hydrochloric acid. Then they calculate the molar volume of the gas produced before answering assessment questions.
University of California
Hot! Hot! Hot!
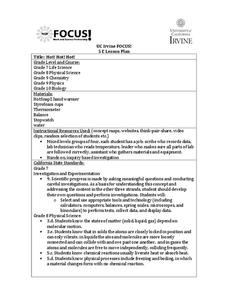
Calories are not tiny creatures that sew your clothes tighter every night, but what are they? A science lesson, presented at multiple levels, has learners experiment with heat, heat transfer, and graph the function over time....
Jason Learning
Tech in the Cycle
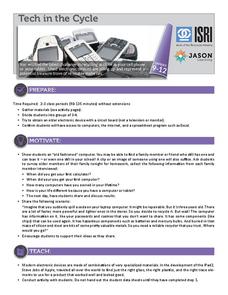
It might not be easy, but it is worth recycling electronics. Small groups determine the percentage of the materials that make up an iPad 2 and display the information in a circle graph. They then research the recycling process for...
Teach Engineering
Creepy Silly Putty
It might be silly to determine the creep rate of putty but groups will enjoy making different formulations of silly putty and playing with them to understand how the different mixtures behave. The second part of the activity has groups...
Balanced Assessment
Who's Left?
If you're not right-handed, are you wrong-handed? Young statisticians calculate the percentage of left-handed people using a given data set in the assessment task. They plot data on a scatter plot and consider how the line of best fit...
West Contra Costa Unified School District
Law of Sines
Laws are meant to be broken, right? Learners derive the Law of Sines by dropping a perpendicular from one vertex to its opposite side. Using the Law of Sines, mathematicians solve for various parts of triangles.
Statistics Education Web
Text Messaging is Time Consuming! What Gives?
The more you text, the less you study. Have classes test this hypothesis or another question related to text messages. Using real data, learners use technology to create a scatter plot and calculate a regression line. They create a dot...
Statistics Education Web
Types of Average Sampling: "Household Words" to Dwell On
Show your classes how different means can represent the same data. Individuals collect household size data and calculate the mean. Pupils learn how handling of the data influences the value of the mean.
Statistics Education Web
Who Sends the Most Text Messages?
The way you use statistics can tell different stories about the same set of data. Here, learners use sets of data to determine which person sends the most text messages. They use random sampling to collect their data and calculate a...
EngageNY
Examples of Dilations
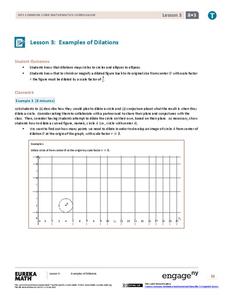
Does it matter how many points to dilate? The resource presents problems of dilating curved figures. Class members find out that not only do they need to dilate several points but the points need to be distributed about the entire curve...
EngageNY
Comparing Irrational Numbers
Build on your classes' understanding of irrational numbers by comparing their values. The 13th lesson in the 25-part module has individuals estimate values of both perfect and non-perfect roots. They finish by graphing these numbers on a...
EngageNY
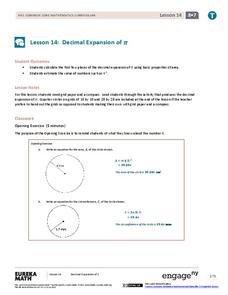
Decimal Expansion of Pi
Develop a better understanding of the value of pi. Learners explore the area of a circle using estimation and graph paper. While continuing to estimate the area of the circle using smaller and smaller grids, the number pi emerges.
02 x 02 Worksheets
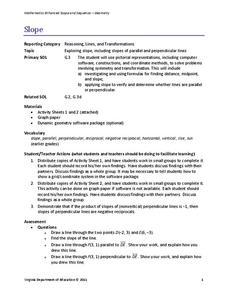
Slope
What does slope have to do with lines? Pupils work with lines and determine the slope of the lines informally and with the slope formula. Groups use their knowledge to calculate the slopes of parallel and perpendicular lines. They also...
PBL Pathways
Boogie Boards
Solve a complex business puzzle by building a linear programming model. An engaging project-based learning problem has classes examining transportation costs and manufacturing limitations from several plants. Ultimately, they use their...
Mathematics Vision Project
Modeling Data
Is there a better way to display data to analyze it? Pupils represent data in a variety of ways using number lines, coordinate graphs, and tables. They determine that certain displays work with different types of data and use...


