Curated OER
Coordinates on a Shower Curtain: Math
Young scholars use a shower curtain to represent a coordinate plane and then physically demonstrate their understanding or ordered pairs as they move from place to place.
NTTI
Line 'Em Up!
Coordinate planes and Cartesian graphing systems are the focus of this math lesson. Learners use video, internet activities, and engage in hands-on activities in order to explore coordinate planes. The materials needed for this lesson...
Curated OER
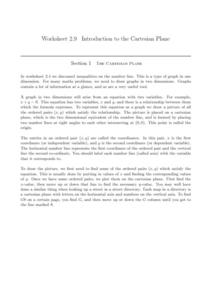
The Cartesian Plane
Learners solve and complete 22 various types of problems. First, they find the gradients of the lines and plot the given points. Then, they complete the table of values for each equation and use the table to draw the graph.
Alabama Learning Exchange
Coordinate Geometry
Where do the coordinates lead? As children brainstorm ways to find the location of different buildings, they learn about coordinate points and how to use them to locate areas on a grid or map. They practice using ordered pairs by playing...
Curated OER
Coordinate Plane and Number Line
In this graph and number line worksheet, students answer multiple choice questions about points on a graph and points on a number line. Students answer 10 questions.
K20 LEARN
Whoopsies, Graphing Edition: Coordinate Plane Graphing
How do you handle common mistakes in your classroom? A graphing activity prepares scholars to recognize common misconceptions when graphing ordered pairs. The activity concentrates on three common graphing mistakes.
Curated OER
Interpret Graphs of Ordered Pairs
Middle and high schoolers solve four word problems based on three different graphs of ordered pairs which show the amount of money spent on lunch on particular days. Next, learners are given two equations of functions, and an x value and...
Curated OER
Number Pairs
What's the coordinate pair? There are 16 letters located on this grid, each marked by a point. Learners record the number pair for each. All of the coordinates are whole numbers. Consider extending this in a fun way by challenging pupils...
Curated OER
Shapes on a grid #1
Before learning about the coordinate plane and ordered pairs, have kids get used finding locations on the grid. They are given a simple set of coordinates, which they will locate on the grid. A great way to introduce the concept.
Curated OER
Interpreting Graphs
Sixth graders interpret linear and nonlinear graphs. They create graphs based on a problem set. Next, they represent quantitive relationships on a graph and write a story related to graphing.
Inside Mathematics
Graphs (2006)
When told to describe a line, do your pupils list its color, length, and which side is high or low? Use a worksheet that engages scholars to properly label line graphs. It then requests two applied reasoning answers.
Corbett Maths
Coordinates and Shapes
Where is the point? Given three points on the coordinate plane, the video walks through the steps to find the location of the fourth point to create a given special quadrilateral. The narrator first determines the coordinates of the...
Illustrative Mathematics
Weather Graph Data
Teaching young mathematicians about collecting and analyzing data allows for a variety of fun and engaging activities. Here, children observe the weather every day for a month, recording their observations in the form of a bar graph....
Scholastic
Study Jams! Ordered Pairs
Using an amusing amusement park, Sam describes how it is a coordinate plane and how to graph an ordered pair. Perfect for beginners, the animation moves on to point out a tip using the first quadrant of an empty coordinate plane.
Curated OER
Graph Ordered Pairs of Integers
In this ordered pairs worksheet, students read the directions in 6 story problems that will tell which way to move on the coordinate plane. Students identify the ordered pairs that name their ending spot.
Virginia Department of Education
Graphing Linear Equations
Combine linear equations and a little creativity to produce a work of art. Math scholars create a design as they graph a list of linear equations. Their project results in a stained glass window pattern that they color.
Curated OER
Coordinate Plotting: Shapes
In this math worksheet, students graph ordered pairs on a coordinate grid. They connect the points to create a geometric shape. This worksheet generator allows teachers to select the size of the grid, the complexity of the shapes, and if...
Curated OER
Coordinate Planes
Identifying the location of ordered pairs on coordinate planes is the focus in the math lesson presented here. In it, 4th graders are introduced to coordinate pairs, the x/y axis, and the techniques associated with this type of graphing....
EngageNY
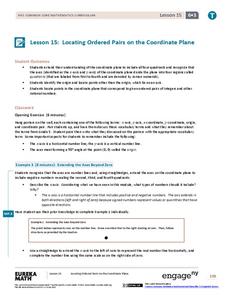
Locating Ordered Pairs on the Coordinate Plane
Four quadrants, four times the fun. Future mathematicians learn the terminology associated with the coordinate plane and how to plot points in all four quadrants. A worksheet tests their understanding of the material in the 16th...
West Contra Costa Unified School District
Graphing Piecewise Functions
Step up to learn about step functions. The activity, designed for high schoolers, first covers piecewise functions and how to draw their graphs. It then introduces step functions, including the greatest integer (floor) and ceiling...
Math Drills
Christmas Cartesian Art Santa
Santa has his eye on you in a graphing activity that has young mathematicians plot ordered pairs on a Cartesian plane. After joining the points together, a picture of jolly Santa Claus comes to life.
Mathed Up!
Coordinates
Young graphers decide where to plot a point given a specific ordered pair. The problems vary in difficulty, beginning with simpler coordinates, and ending with plotting and connecting coordinates. Each graph is labeled with the...
EngageNY
Graphing the Logarithmic Function
Teach collaboration and communication skills in addition to graphing logarithmic functions. Scholars in different groups graph different logarithmic functions by hand using provided coordinate points. These graphs provide the basis for...
EngageNY
Graphs of Simple Nonlinear Functions
Time to move on to nonlinear functions. Scholars create input/output tables and use these to graph simple nonlinear functions. They calculate rates of change to distinguish between linear and nonlinear functions.


