Curated OER
Finding Domain and Range
In this domain worksheet, students study graphs of equations and determine the domain and range of each one. Afterwards, they solve equations to find the domain. There are 15 problems on this one-page worksheet.
Curated OER
Word Problems
Students solve word problems using mathematical symbols. In this algebra lesson, students collect data and analyze it. They analyze the data using a table or graph after plotting the data.
Curated OER
Integers
Students graph integers on a number line. For this integers lesson, students create a colored foldable to assist them with notetaking and problem solving. Students complete exercises from text.
Curated OER
High School Mathematics Problems from Alaska: Jesse Thomas Moose Hide Problem
Students solve problems about a student earning money for college by tanning moose hides.
EngageNY
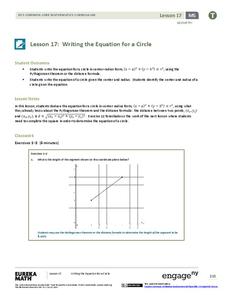
Writing the Equation for a Circle
Circles aren't functions, so how is it possible to write the equation for a circle? Pupils first develop the equation of a circle through application of the Pythagorean Theorem. The lesson then provides an exercise set for learners to...
Curated OER
Algebra 1, Unit 7, Lesson 8: Practice Finding the Equation of a Line
Students solve systems of linear equations by graphing. The introduction of the lesson asks students to work in pairs or small groups to graph a line when given two points. Students graph 14 equations on the same coordinate grid to...
Curated OER
The Muckrakers Interdisciplinary Unit
Eighth graders complete an Interdisciplinary Unit on the Muckrakers and the Progressive Movement. Students describe life in America and how Progressive Reformers changed it. identify specific problems and propose solutions. Students...
Curated OER
Points on a Line
How do you find slope? You use points on a line of course. slope. Teach your class how to calculate and differentiate between horizontal and vertical lines. They are sure to be pros at graphing lines on a coordinate plane by the end of...
Curated OER
Zeros of a Quadratic Function
Factor quadratic equations by teaching your students how to identify the zeros of the quadratic function. They use the TI to see where the graph will intercept the coordinate plane.
Curated OER
Snowfall Statistics for Snowboarding
Students use the Internet to collect the current daily snowfall amounts and also to find the price of a lift ticket for snowboarding at different ski resorts in the United States.
Curated OER
Mapping with a Compass: A Simulated Survey
Students use compasses and grids to map the locations of artifacts found in a simulated dig site. In groups, they role-play as future archeologists excavating a school site. Groups begin at their assigned datum and site the artifacts...
Curated OER
Average Temperature
Fourth graders study temperature. In this average temperature lesson students record temperature data, calculate and analyze average temperatures and construct a time line graph.
Curated OER
Algebra 1
Students study the functional relationships of a variety of problems. In this functional relationship lesson, students determine the dependent and independent quantities of a given set of data. Students record the data and...
Curated OER
Data
Students collect data from an experiment they perform. In this data activity, students use multiple representations to solve practical problems; describe advantages and disadvantages of the use of each representation. Then, they evaluate...
Pennsylvania Department of Education
Introducing the Coordinate Plane
Fifth graders practice using estimation. In this estimation lesson, 5th graders add, subtract, multiple, and divide using whole numbers, fractions, and decimals. Students decide upon instances when estimation is more appropriate than...
Virginia Department of Education
Transformations
Geometry in life-sized dimensions! Using enlarged graph paper, pupils perform a series of transformations. By recording the initial and final placement of the images, they are able to analyze the patterns in the coordinates during a...
Curated OER
Real-World Linear Programming
Explore linear programming on a website game. Partners solve a real-world problem by setting up an objective function and a linear inequality. They graph their results on chart paper and also using a calculator before presenting their...
Illustrative Mathematics
Walk-a-thon 1
Your mathematician's job is to explore the relationship between hours and miles walked during a walk-a-thon. The activity compels your learners to experiment with different means in finding out this proportional relationship. The answer...
Curated OER
Where am I Located
Students calculate and find a certain location. In this geometry instructional activity, students examine a coordinate plane for pair of coordinates. They calculate the distance between point using the distance formula and estimation.
Geophysical Institute
Latitude and Longitude with Google Earth
Travel the world from the comfort of your classroom with a lesson that features Google Earth. High schoolers follow a series of steps to locate places all over the earth with sets of coordinates. Additionally, they measure the distance...
Curated OER
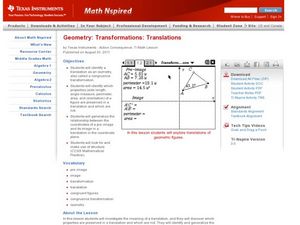
Transformations-Translations
Students perform transformations and translation on a coordinate plane. In this geometry lesson, students move shapes around on a graph identifying translation, image, and transformation. This lesson has an interactive part online that...
Curated OER
Race The Rapper: Slopes
Students calculate the slope of the equation For this algebra lesson, students graph coordinate pairs of linear equations and identify the relationship between x and y values and slope. They differentiate between functions and...
Illustrative Mathematics
Walk-a-thon 2
During a walk-a-thon your learners must determine the walking rate of Julianna's progress. Using tables, graphs, and an equation, they must be able to calculate the time it took her to walk one mile and predict her distance based on the...
Curated OER
"If You Hopped Like a Frog" by David M. Schwartz
Students search for and generalize an algebraic pattern. They make and analyze a coordinate graph.


