Curated OER
Math 53 - Review for Midterm 1
In this review for midterm, students use parametric equations to find points on a curve, explore conic sections, write vector functions, and sketch cylindrical coordinates. This two-page review contains 10 multi-step problems.
Curated OER
Statistics
In this statistics worksheet, students view 6 graphs to determine the correlation. Students then answer 4 questions that involve plotting data, determining a relationship, and making predictions.
Curated OER
Linear & Quadratic Functions: Solving Graphically
In this linear and quadratic function worksheet, students examine and solve a system of equations. They graph each function on a coordinate plane. This one-page worksheet contains ten problems.
Curated OER
Reflection: Student Worksheet
In this math worksheet, students will work independently to trace a stencil on an x-axis. Then students will follow a procedure to trace the image on the horizontal line of reflection. Students will observe that reflections and rotations...
Curated OER
Math A Regents Questions: Points on a Line
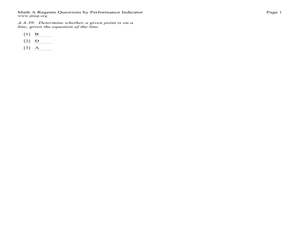
In this linear equations worksheet, students solve 3 multiple choice problems. Students determine if a given point lies on a line given an equation of that line.
Curated OER
Analyzing Data Sets
In this analyzing data sets worksheet, 11th graders solve and complete 35 various types of problems that include the analysis of data given. First, they determine the equation that best describes the data shown in a table. Then, students...
Curated OER
Solving Systems of Linear Equations in Three Variables
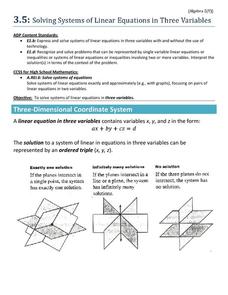
Practice solving linear systems of three equations with three unknowns using the elimination method and substitution method. This handout includes graphics of different combinations of intersecting planes to help illustrate the different...
Curated OER
High School Mathematics Problems from Alaska: Firewood Problem
Students write and solve equations for the cost of firewood by the cord, then use this information to develop tables of values and graph their equations.
Curated OER
Integration: Geometry, Parallel and Perpendicular Lines
In this math worksheet, learners write linear equations in slope-intercept form that passes through the given point. On the last 8 equations, students write the equation of the perpendicular line.
Curated OER
Functions
In this functions worksheet, 11th graders solve and complete 30 various types of multiple choice problems that include reading and interpreting functions and patterns. First, they determine the table that best represents a function....
EngageNY
Finding Systems of Inequalities That Describe Triangular and Rectangular Regions
How do you build a polygon from an inequality? An engaging lesson challenges pupils to do just that. Building from the previous lesson in this series, learners write systems of inequalities to model rectangles, triangles, and even...
Inside Mathematics
Functions
A function is like a machine that has an input and an output. Challenge scholars to look at the eight given points and determine the two functions that would fit four of the points each — one is linear and the other non-linear. The...
West Contra Costa Unified School District
Sneaking Up on Slope
Pupils determine the pattern in collinear points in order to determine the next point in a sequence. Using the definition of slope, they practice using the slope formula, and finish the activity with three different ways to determine the...
Balanced Assessment
Catenary
Develop a model for a hanging chain. Pupils find a mathematical model for a hanging chain and then they compare their models to the precise function that models the curve. Scholars come up with a strategy to determine how close their...
Balanced Assessment
Para-Ball-A
Analyze the flight of a thrown ball. Learners determine the maximum height of a thrown ball and the time it takes to hit the ground given its initial speed. They continue to review different scenarios with different maximums or different...
EngageNY
The Computation of the Slope of a Non-Vertical Line
Determine the slope when the unit rate is difficult to see. The 17th part of a 33-part series presents a situation that calls for a method to calculate the slope for any two points. It provides examples when the slope is hard to...
Curated OER
Worksheet 23 - Directional Derivative
In this function worksheet, students compute the directional derivative of a function and identify the xy-coordinates of the maximum and local minimum. This two page worksheet contains six multi-step problems.
Curated OER
Inverse Relations
In this Algebra II worksheet, 11th graders graph functions on a coordinate plane. Students determine values for which the function is undefined and explore reciprocal functions. The one page worksheet contains thirty-two problems....
Curated OER
Worksheet 4 - Math 126: Sketching Polar Equations
In this sketching polar equations worksheet, students solve 5 short answer and graphing problems. Students describe a curve given the equation of the curve in polar form. Students sketch a graph of the equation.
Curated OER
Solving Systems of Inequalities
For this algebra worksheet, students solve systems of inequality using the graphing method. There are 5 questions with lots of examples and an answer key.
Curated OER
Exponential Functions
In this algebra activity, students evaluate exponential functions using tables and graphs. There are 6 questions with an answer key.
Curated OER
Periodic Functions
In this calculus worksheet, students identify important rules and properties of the unit circle. They differentiate between polar and complex coordinates. There are 20 questions about the unit circle.
Curated OER
Precalculus Exam
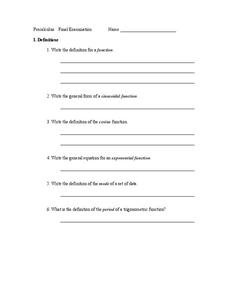
For this precalc lesson, students write out definitions, identify functions, solve integrals and derivatives and graph trig functions as they relate to angles. This is a final exam for precalculus. There are 80 questions on this exam.
Curated OER
Slope Exploration
In this slope exploration activity, 9th graders solve and complete 18 different problems that include graphing and investigating the slope of various equations. First, they graph each pair of points and draw a line that contains both...


