Curated OER
Collecting And Fitting Quadratic Data
Learners investigate the concept of using quadratic data to plot coordinates on a plane. They also apply the quadratic formula for a variety of problems with the help of a graphing calculator to draw the parabola for given coordinates.
Curated OER
You Can Find It!
Students locate different places including U.S. cities using longitude and latitude coordinates. In this longitude and latitude lesson plan, students locate 10 different locations.
Curated OER
Measurement and the Illampi Mound Colony
Students comprehend the basic units of measurement, scale, plotting, and basic grids. Students practice their estimation
and measuring skills and will demonstrate their ability to work well in groups.
Curated OER
Comparison of Two Different Gender Sports Teams - Part 3 of 3 Scatter Plots and Lines of Best Fit
Students create a scatter plot for bivariate data and find the trend line to describe the correlation for the sports teams. In this scatter plot lesson, students analyze data, make predictions,and use observations about sports data...
Curated OER
Location, Location, Location: Using a Grid to Determine Context
Seventh graders are introduced to making inferences about artifacts. Using a grid system, they locate the artifacts and determine where they originated from. They use this information to make conclusions about the way people lived...
Curated OER
Mathematics Within: Algebraic Patterns
Pupils discover patterns in linear equations by playing a dice game to collect data. They graph the data and analyze the patterns of the lines created by the data. The class then compares the individual graphs to evaluate the position of...
Curated OER
Transformations
Seventh graders complete activities to perform transformations of various figures and describe the transformations. For this transformations lesson, 7th graders perform a translation, a rotation, and a reflection on graph paper. Students...
Curated OER
Cracks on the Walls
Students observe the cracks in school walls and pavements. In this geometry lesson, students explore the factors to be considered before building a structure. They complete a graphing and calculation worksheet after the lesson.
Curated OER
Linear Progression
Students use graphing calculators to graph lines and create tables of values. They perform an experiment using M&M's and slinkys, then create their tables based on their results.
Curated OER
Quadratics: vertex form
Learners practice graphing quadratic equations to find the vertex of quadratic functions. They determine if the graph opens upward or downward as well as convert quadratic equations to vertex form from polynomial form. A lab version is...
Curated OER
Quadratics: Vertex Form
High schoolers practice graphing quadratic equations. They work to solve and equation involving finding the vertex using given formulas. Once their points have been graphed, students determine the direction in which the angle opens....
Curated OER
Bungee M&M's
Eighth graders experiment with M&M's and a cup attached to a spring to to simulate a bungee jump. They graph the results of the experiment and make predictions for continuing the experiment. They determine the "line of best fit."
Curated OER
Cutting Cordwood
High schoolers examine a story problem in which two men are earning money by cutting cords of wood. They use data from graphs to use on a grid. They practice writing algebraic equations as well.
Curated OER
Line Best Fit
Students identify the line of best fit. For this statistics lesson, students analyze graphs and plots to identify positive, negative or no correlation. They find the line of best fit for different scatter plots.
Physics Classroom
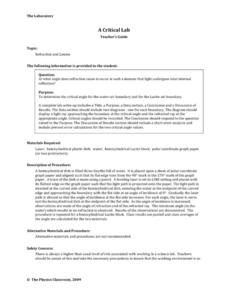
A Critical Lab
Physics lab groups finagle with laser lights to determine the critical angle of refraction for both water and Lucite. Because there are no detailed steps or an answer key for this enlightening exercise, an inexperienced physics...
EngageNY
Arithmetic and Geometric Sequences
Arithmetic and geometric sequences are linear and geometric patterns. Help pupils understand the relationship and see the connection with an activity that asks them to write the rules and classify the patterns correctly. A sorting...
Alabama Learning Exchange
The World of Integers
Review operations related to rational numbers and integers using the include PowerPoint presentation, "Interesting Integers." Young mathematicians classify rational numbers as being natural, whole, or integers and read an article about...
Willow Tree
Midpoint and Distance Formulas
The shortest distance between two points is a straight line. Learners use the Pythagorean Theorem to develop a formula to find that distance. They then find the midpoint using an average formula.
West Contra Costa Unified School District
Congruence Through Transformations
Transform your instructional activity on transformations. Learners use given congruent triangles and tracing paper to determine the single transformation that carries one to the other. The concept is extended to combinations of...
Illustrative Mathematics
Do Two Points Always Determine a Linear Function?
Your learners can approach this task algebraically, geometrically, or both. They analyze the building of a linear function given two points and expand the concrete approach to the abstract when they are asked to find the general form of...
Laboratory for Atmospheric and Space Physics
Growing Up With A Mission
New Horizons began its journey to Pluto in 2006. Ten years later, it continues its mission. In that time, scholars have surely grown, but how much more will they grow by the time New Horizons reaches its destination? Find out with an...
Curated OER
Dragonfly
The speed of a dragonfly brings math into the real world as your learners collaboratively see the value in calculating unit rates in direct proportion problems. This six-phase lesson encourages you, as the teacher, to only ask questions...
Kenan Fellows
Math Made Simple as 1-2-3: Simplified Educational Approach to Algebra
Writing an equation of a line is as easy as m and b. A lesson presentation gives individuals different strategies for writing equations of lines. Some items provide a slope and a point while others provide two points. Whatever the given,...
Curated OER
Separate Vacations
Students plot the migration paths of birds using latitude and longitude data from a table.


