Curated OER
Graph Those Stickers!
Students graph fruit. In this graphing lesson students create a graph using fruit label stickers. Students place a sticker on the graph when the fruit has been consumed.
Curated OER
Grasping Graphs
In this grasping graphs worksheet, students solve and complete 3 different types of problems. First, they graph the data described and select the appropriate graph type. Then, students identify the independent and dependent variable. In...
Curated OER
Graphing Activity
In this probability and statistics worksheet, students work with a family member to construct graphs based on real life data. The two page worksheet contains three questions. Answers are not included.
Curated OER
Creating Circle Graphs with Microsoft Excel
Students create graphs of circles. In this geometry lesson, students use Microsoft Excel to create graphs. They construct the graphs using paper and pencil as well as the computer.
Curated OER
From Playing with Electronics to Data Analysis
Students collect and Analyze data. In this statistics lesson, students identify the line of best fit of the graph. They classify lines as having positive, negative and no correlation.
Curated OER
Which Graph is best?
Students use commercial software to organize and visually display data to draw conclusions; students use graphing software to create several types of graphs illustrating the number of each color of M&M's in one bag.
Curated OER
The Dog Days of Data
Students practice an alternative form of data presentation. They practice sequencing data, identifying the stem-and-leaf, creating stem-and-leaf plots, and drawing inferences from the data by viewing the plots.
Curated OER
Sorting and Graphing Animals
Students inquire about animals using SIRS Discoverer or eLibrary Elementary. In this organizing data lesson, students sort pictures of animals in various ways and develop graphs. Students locate a mammal, reptile, fish, insect or bird...
Curated OER
Graph a Panther's Diet
Pupils examine the diet of panthers. In this interpreting data instructional activity, students collect data on the panther's diet and chart the data in bar and pie graphs.
Curated OER
Organizing And Reading Data
Students complete three parts of an "Organizning and Reading Data" worksheet. First, they go over the rubric to determine the work will be scored. They organize data by taking tallies, make a pictograph and a bar graph using the data....
Curated OER
Bar Graph- Calories In Fast Food Items
In this bar graph worksheet, learners analyze a bar graph that shows calories in 10 fast food menu items. Students answer 7 questions about the graph.
Curated OER
Graphing Climate Information
Seventh graders plot the data for the average monthly precipitation for three cities. They make a graph using a spreadsheet.
Curated OER
Skittle Graphing (Lesson Plan)
Students discuss the uses of graphs. They use color candies to count and sort before designing graphs. They label the graph papers with appropriate titles and candy colors. They complete the graph bars, and discuss the results with a...
Curated OER
Data Collection and Presentation
Students concentrate on discrete quantiative data. They are shown that the vertical line diagram as a more appropriate way to present discrete quantiative data then bar charts. Students work as a group to help with the interpretation...
Curated OER
Making A Horizontal Bar Graph
In this bar graph instructional activity, students create a bar graph to display 6 scores from basketball games. Students will label the x and y axis and correctly plot the scores from the table provided.
Curated OER
Organising Data
Students complete data organization activities. In this data organization lesson, students watch online clips about organizing data. Students complete an eye color frequency table for their class. Students watch a clip about asking...
Curated OER
Evaluating Data
In this data worksheet, students learn how to organize the data collected during an experiment and practice finding patterns. Students graph a table of experimental data and complete 1 short answer question.
Curated OER
Make Line Graphs
In this graphing worksheet, 5th graders use 2 line graphs to answer 4 word questions. They use data from two charts to make a single and a double line graph.
Curated OER
Making Bar Graphs
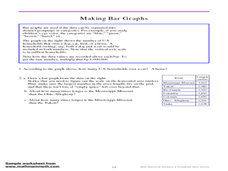
In this bar graph worksheet, students answer short answer questions about bar graphs. Students answer 1 question about a bar graph about a cat, and 3 questions about a bar graph about U.S. rivers.
Curated OER
Graphing Conversation Hearts
Students collect data and create a graph. In this mathematics lesson plan, students separate paper hearts by color and create a graph showing the number of hearts of each color present. Students receive a handful of candy hearts that...
Curated OER
Immigration and American Life Graphing Immigration Data
Young scholars practice graphing immigration data from the Caribbean. After practicing making their own graphs, they make the final graph and label it accordingly. They work together to determine the six most populated states of...
Curated OER
Graphing Scatterplots
Pupils examine scatterplots and determine the equation of a line using the slope-intercept method. Students interpret graphs, draw inferences, and sketch a curve of best fit for the graph. Based upon patterns in the graphs, pupils...
Other popular searches
- Data Analysis Graphing
- Graphing and Analyzing Data
- Data and Graphing
- Graphing Data Project
- Collecting and Graphing Data
- Graphing Data in Science
- Collecting Data Graphing
- Organizing and Graphing Data
- Mathematics Graphing Data
- Data Tables and Graphing
- Line Graphing Data
- Graphing Data in Astronomy


