Curated OER
Using Circle Graphs
In this circle graphs worksheet, students read a story about buying craft materials. Students examine the circle graph that shows how much spent on each type of material. Students then solve 3 problems using the data shown.
Curated OER
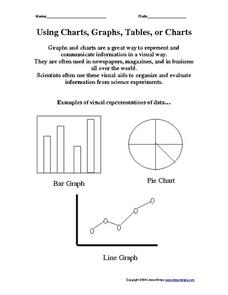
Using Charts, Graphs, Tables, or Charts
In this charts, graphs and tables activity, students view 3 different types of visual representations of data, make a list of 20 items and decide how the items can best be put together in groups to make a graph, chart or table. Students...
Curated OER
Data Analysis
In these data analysis worksheets, students complete 4 worksheets of activities for analyzing data. Students use the mean, median, mode, and range to organize the data.
Curated OER
Handling Data: Collecting and Recording Data
Young scholars collect and record data. In this collecting and recording data lesson, students collect data and record that data using frequency tables which include the x and y axis.
Curated OER
Visual Communication of Quantative Data
Students collect and analyze data based on academic performance. In this statistics lesson, students create graphs and analyze the data they created. They use positive, negative and no correlation to analyze the data.
Curated OER
Bar Graphs and Pie Charts
Fourth graders explore their interest and strengths and display them using a bar graph and pie chart.
Curated OER
Horizontal Bar Graph-- Blank Grid
In this math activity, students use the blank horizontal bar graph to record and display any data and to learn the correct way to generate a bar graph. Spaces are marked for students to write in the title and labels; intervals of 1-10...
Curated OER
Collecting And Organizing Data
In this collecting and organizing data worksheet, students, with a partner, problem solve and calculate the answers to six mathematical word problems.
Curated OER
St. Patrick's Day Lucky Charms Sort Bar Graph
In this elementary data collection and graphing worksheet, students paste the correct cereal pieces to match the words at the bottom of the bar graph. They count the items and fill in the graph in this St. Patrick's Day themed activity.
Curated OER
Problem-Solving Application: Use Circle Graphs
In this problem-solving worksheet, 5th graders problem-solve 2 mathematical equations involving 4 key steps and 2 circle graphs.
Curated OER
Frequency Histograms, Bar Graphs and Tables #3
In this frequency histograms worksheet, students examine bar graphs, histograms and tables. They identify the model of information that best matches the statistics. This three-page worksheet cotnains two multiple-choice problems. ...
Curated OER
Using Graphs and Charts
Students complete T charts and manipulate numbers using graphs and charts. In this math graphs and charts instructional activity, students review the concepts of pattern and function. Students then complete practice pages where they...
Curated OER
M&M's Candies Worksheet Graph
In this graphing worksheet young scholars will record data on a bar graph. Students will take a bag of M&M's and chart the colors they find inside this bag.
Curated OER
Favorite Season Circle Graph
Students create a graph charting their favorite season. They discuss the difference in the four seasons and activities they participate in, in each of the seasons. They can also take a survey of their family members and add them to the...
Curated OER
Line Graphs 4
In this graph worksheet, students interpret given line graphs. They determine the range, and identify the range in a set of data. This one-page worksheet contains approximately 14 problems.
Curated OER
Use a Bar Graph
In this bar graph worksheet, students use data from a bar graph to solve an addition sentence. To help students solve the problem they use the problem solving strategies of understand, plan, solve, and look back.
Curated OER
Collect and Organize Data: Reteach
In this data collection worksheet, students learn the parts of a tally chart and how it organizes information. Students then use the second tally chart to help them answer the six questions.
Curated OER
Double Bar Graphs
In this double bar graphs practice worksheet, students sharpen their problem solving skills as they solve 6 story problems.
Curated OER
Halloween Graph Paper
For this Halloween graphing worksheet, 5th graders enhance their math skills by using the graph to help them collect and organize data.
Curated OER
Collect and Organize Data: Homework
For this collecting and organizing data worksheet, students use the tally chart for the students' eye color to answer the first two questions. Students then survey their family for eye color, record those results in a tally chart, and...
Curated OER
Collect and Organize Data
In this data analysis learning exercise, 4th graders use a tally chart about favorite television programs. They record which are least or most popular, rankings, and combinations of programs.
Curated OER
Data Handling: Pictogram of Birds
In this pictograph problem solving worksheet, students analyze a pictograph of birds seen each day for a week. They use the information on the graph to solve 6 problems.
Curated OER
Toy Sale- Writing Number Sentence and Using a Data Table Enrichment Worksheet
In this number sentence and data table enrichment worksheet, 1st graders write a number sentence using information from a data table to solve an equation in 4 examples.
Curated OER
Think Science - Collecting Data
In this data collection worksheet, students collect data about butterflies and milkweed plants and record the measurement tools they use to collect it. Students complete 2 columns.
Other popular searches
- Data Analysis Graphing
- Graphing and Analyzing Data
- Data and Graphing
- Graphing Data Project
- Collecting and Graphing Data
- Graphing Data in Science
- Collecting Data Graphing
- Organizing and Graphing Data
- Mathematics Graphing Data
- Data Tables and Graphing
- Line Graphing Data
- Graphing Data in Astronomy


