Curated OER
Creating Climographs
Students use satellite data to compare precipitation and surface temperatures on different islands. In this satellite lesson students create graphs and explain the differences between weather and climate.
Teach Engineering
Start Networking!
Class members create their own social networks by collecting signatures before graphing the interactions with their fellow classmates. The degree distribution of the simulated social network is determined by calculating the degree of...
University of Georgia
Splat!
What does viscosity have to do with splatter? An activity shows that the viscosity of a substance is inversely proportional to the distance of its splatter. Learners conduct the experiment by collecting data, graphing, and analyzing the...
Teach Engineering
Linear Regression of BMD Scanners
Objects may be more linear than they appear. Scholars investigate the relationship between the number of bone mineral density scanners in the US and time. Once they take the natural logarithm of the number of scanners, a linear...
Curated OER
Just Me and My Shadow
Young scholars take measurements throughout the day using a simple sundial called a gnomon. They record the results on a Data Log and convert from English units to metric (S.I.) units. Data points are plotted on the same graph and analyzed.
Curated OER
Now That's Using Your Head!
Explore linear measurement. Scholars will measure the circumference of their head and the distance they can jump. Information is recorded, averages are calculated, and a data table is completed. They then determine possible relationships...
Code.org
Encoding B and W Images
Imagine drawing with zeros and ones. The third lesson in a unit of 15 introduces the class to creating black and white images. Pairs get together to create an encoding scheme in order to make these images. They move on to a using a...
Howard Hughes Medical Institute
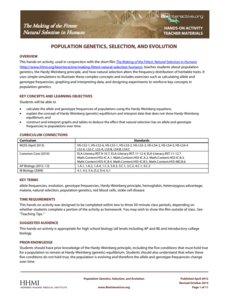
Population Genetics, Selection, and Evolution
The Hardy-Weinberg principle states that alleles and genotypes remain constant in the absence of evolutionary influences. Scholars complete a simple hands-on activity applying the Hardy-Weinberg principle to sample data. They observe how...
Virginia Department of Education
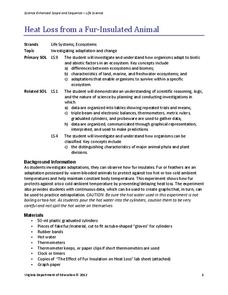
Heat Loss from a Fur-Insulated Animal
How do animals adapt to weather changes? Provide your class with the ability to understand adaptations and body temperature as they participate in this hands on experiment, using fake fur and hot water. Pupils collect data and analyze...
Beyond Benign
Exothermic and Endothermic Reactions
How can you tell the difference between endothermic and exothermic reactions? Chemistry scholars perform and observe two chemical reactions, measure the temperature throughout, then draw conclusions about changes in energy from their...
Teach Engineering
Matching the Motion
It is not always easy to walk the straight and narrow. In the sixth portion of a nine-part unit, groups actively recreate a graph depicting motion. Individuals walk toward or away from a motion detector while trying to match a given...
Curated OER
Tell Us All: Tools for Integrating Math and Engineering
What a scam! Middle and high schoolers pose as journalists exposing consumer fraud. In this lesson, they write an article for a magazine using data collected during previous investigations (prior lessons) to defend their findings that a...
Howard Hughes Medical Institute
DNA Sequence Assembly
Oncologists use DNA sequence data to identify specific cancers and offer more targeted treatments. Grasp an understanding of the complexity involved by learning how the body sequences and assembles DNA. Eager scientists explore the...
Virginia Department of Education
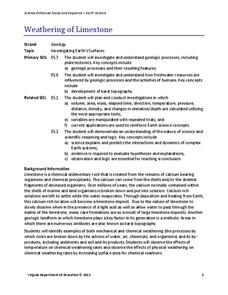
Weathering of Limestone
We all know limestone weathers, but what affects the rate of weathering? Young scientists investigate the physical and chemical weathering of limestone (chalk) through experimentation. First, they conduct trials with different-size...
Howard Hughes Medical Institute
Mass Extinctions Interactive
Extinctions constantly occur, but what sets off a mass extinction event? Young scientists study the data from the previous five mass extinctions to better understand their causes. Then, they learn the impact each extinction had on our...
Biology in Motion
Evolution Lab
Evolution occurs though change over time, but can it go any faster? Scholars speed up the process of evolution and observe a simulation of 20 blue organisms fighting for survival. A graph displays the changes in phenotype over time. By...
Pingry School
Gas Pressure and Volume Relationship
Do your high school scientists know the four methods scientists use to communicate information? A simple experiment discovering the relationship between gas pressure and volume allows pupils to practice all four. After completing the...
Concord Consortium
Double Pendulum
What's better than a pendulum for studying motion and periods? A double pendulum! Young physical scientists use an interactive to explore pendulum motion—times two. The resource boasts a host of parameters to change and a running graph...
Howard Hughes Medical Institute
Paleoclimate: A History of Change
Earth's climate changed drastically throughout the history of the planet, so why do scientists blame humans for recent changes? Observe data covering the history of the planet that proves the natural climate change patterns. Then, learn...
PBS
Analyzing Light Curves of Transiting Exoplanets
Scientists detected exoplanets by measuring how the brightness of stars changed over time. Young astronomers interpret and analyze the same data that led to exoplanet discoveries. They learn to apply light curve graphs and connect the...
Curated OER
Weather, Data, Graphs and Maps
Students collect data on the weather, graph and analyze it. In this algebra lesson, students interpret maps and are able to better plan their days based on the weather reading. They make predictions based on the type of clouds they see.
Curated OER
Applied Science - Science and Math Lab
Students make a prediction. In this applied science instructional activity, students guess the number of items in a jar. Students create a bar graph to show the predictions and the actual amounts.
Curated OER
Making a Line Graph
In this line graph worksheet, students use data given in a table and assign axes, make a scale, plot data and make a line or curve on their constructed graphs.
Curated OER
Mass/Weight/Data/Graphing-What Is The Mass of a Dinosaur?
Students determine the mass of various "dinosaur eggs" and graph their data. In this mass, weight, data and graphing lesson plan, students measure the mass of different weighted "dinosaur eggs". They record their data and transfer it to...


