Curated OER
Invasives and Marsh Birds
Students are taught that invasive plant removal can have a variety of impacts. They are shown this by using graphs. Students view maps of vegetation change on Iona Island. They discuss implications of changes on marsh birds using data...
Curated OER
Time Management
Young scholars record their daily activities and graph the results using the educational software program called Inspiration. This lesson is intended for the upper-elementary classroom and includes resource links and activity extensions.
Curated OER
Frequency Tables - Home Link Support
For this home school support worksheet, 2nd graders, with a home support person, review the use of frequency tables to organize and display data. They make their own frequency table and read it with the support person.
Curated OER
What Can I Afford?
Students explore the concept of cell phone plans. In this cell phone plan instructional activity, students research the cost of cell phones. Students compare various cell phone plans and decide on which phone plan is best for them.
Center Science Education
Investigating the Climate
What do graphs of atmospheric gases over time show us? Do they indicate that carbon sources and carbon sinks are not in balance? Up-and-coming meteorologists watch video clips, read information, and analyze data from the HIPPO (HIAPER...
Curated OER
2nd Grade - Act. 28: Calendar & Weather Book
Second graders will track the weather patterns throughout the school year. This project spans the school year and takes five minutes per day or less. Measuring, data collection, and predictions are all explored throughout this relevant...
Curated OER
What are Igneous Rocks and How are They Formed?
Crystals form before your very eyes! What sixth grader wouldn't enjoy this lesson plan on igneous rock formation? Using hot Salol, junior geologists observe the crystal formation process as the material cools. This comprehensive lesson...
Curated OER
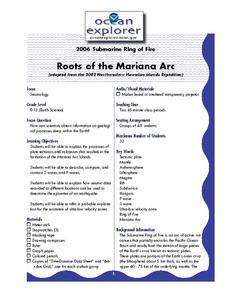
Roots of the Mariana Arc
Plumb the depths of the Submarine Ring of Fire and explore seismic waves with this lesson. Junior geologists simulate s-waves and p-waves, calculate their speeds, and then apply the data to discover the material that makes up inner...
Curated OER
Velocity of Traffic on Highway 26
Physics fanatics time five cars as they pass on the highway. They use the times and a 20-yard distance to calculate velocity. They also graph distance vs. time. A page of student pre-lab questions is provided in addition to the activity...
Curated OER
Radioactive Simulations
Students simulate radioactive decay and nuclear power using an on line interactive web site. In this on line lesson plan, students monitor radioactive isotopes and record the activity of a particular element as the decay progresses. They...
Curated OER
How to Float an Egg
Use the scientific method to experiment with an egg. Your class can examine buoyancy and density by finding how many spoons of salt are needed to float an egg. They can predict, experiment, record data, and analyze results.
STEM for Teachers
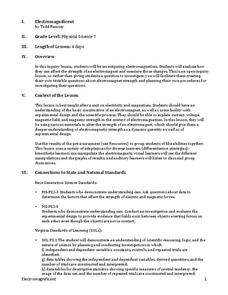
Electromagnificent
This physics pun really hertz, but this STEM lesson plan can help. The inquiry-based activity has young scientists create a testable question about electromagnetic strength; plan and implement their own experiments; and record and...
Curated OER
Settlement Exploration: Then and Now
NASA has crafted an imaginative and memorable series of lessons, "NASA and Jamestown Education Module." This instructional activity is one of the five components. In it, middle schoolers connect history and science by comparing the...
Curated OER
Our Solar System and Seasons
Sixth graders investigate the relative diameters of planets and distances between them and the cause for seasons on Earth using the 5-E Learning Model. They appreciate the size and distances involved with objects in the real universe....
Curated OER
Determining the Density of a Liquid
Young scholars find the density of diet soda and regular soda. In this density lesson plan, students measure the mass of a graduated cylinder with 10 different volumes of each soda. They find the mass of the liquid alone and use the...
Curated OER
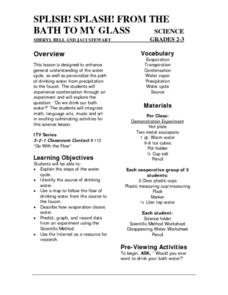
Splish! Splash! From the Bath to my Glass
An excellent lesson on the water cycle! In it, learners should gain a general understanding of the water cycle, along with how water first falls as precipitation, then ends up coming out of our faucets. This lesson nicely integrates...
Curated OER
Turning the Tide on Trash: Marine Debris Curriculum
Seven pages of fascinating reading on marine debris preface the activities in this lesson plan. Four different activities are employed to simulate how the debris is distributed in the ocean and along beaches. Early ecology learners...
Curated OER
Solar Kit Lesson #7 - Positioning Solar Panels I: Explorations with Tracking
In this first part of a two-part lesson, learners track and record the sun's azimuth using a solar panel. They graph and analyze the data to identify relationships among the time of day, the altitude and azimuth of the sun, and the...
Center Science Education
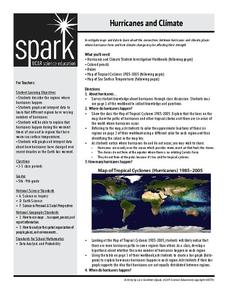
Hurricanes and Climate
Feeling under the weather? This lesson on hurricanes can whip things up! With professionally designed maps and handouts, teach your future weathermen (or women) where, when, and how hurricanes occur. They identify hurricane regions and...
National Research Center for Career and Technical Education
STEM: Lou-Vee Air Car
A comprehensive lesson plan on acceleration awaits your physicists and engineers! Two YouTube videos pique their interest, then sample F=ma problems are worked and graphed. The highlight of the lesson plan is the building of a Lou-Vee...
Curated OER
Living Environment 2004
In this living environment worksheet, students answer 30 multiple choice questions and 42 short answer questions in preparation for the Regents exam.
Curated OER
Is Portland, Oregon Experiencing Global Warming?
Students use data to determine if the climate in Portland has changed over the years. In this weather lesson students complete line graphs and study long wave radiation.
Curated OER
How Big Is The Playground?
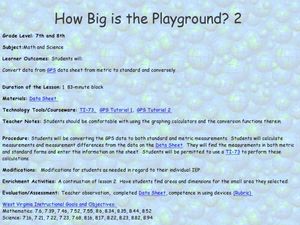
Students calculate the standard and metric measurements of a playground. In this measurement lesson, students use GPS coordinates and graphing calculators to determine the dimensions of an area outside of the school in both standard and...
Curated OER
Snow Cover by Latitude
Learners create graphs showing the amount of snow coverage at various points of latitude and compare graphs.


