Consortium for Ocean Leadership
Nannofossils Reveal Seafloor Spreading Truth
Spread the word about seafloor spreading! Junior geologists prove Albert Wegener right in an activity that combines data analysis and deep ocean exploration. Learners analyze and graph fossil sample data taken from sites along the...
Curated OER
Survey of Height
For this data collection worksheet, learners survey the heights of their fellow classmates, organize their data in a data table, and create a bar graph from their data. Once bar graph is completed, students complete 2 short answer...
University of Colorado
Using Spectral Data to Explore Saturn and Titan
Saturn's rings are made of dust, ice, and solid chunks of material. Individuals use spectrographs in this final installment of 22 lessons to determine the atmospheric elements. They analyze spectrums from Titan's atmosphere and Saturn's...
NOAA
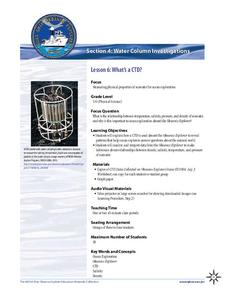
What's a CTD?
Why are the properties of the water important when exploring the ocean? Young scientists discover the tools and technology used in deep sea exploration in the fourth installment in a five-part series. Groups work together to examine...
Columbus City Schools
Totally Tides
Surf's up, big kahunas! How do surfers know when the big waves will appear? They use science! Over the course of five days, dive in to the inner workings of tidal waves and learn to predict sea levels with the moon as your guide.
NOAA
A Matter of Density
Larvae transportation on the New England seamounts is based on the density of the water. Scholars calculate density and graph salinity versus temperature to better understand the distribution of organisms in a water column. Discussions...
Curated OER
M&M Science and Math
A series of math and science activities feature M&M's® as manipulatives to help kids work through equations. The resource includes exercises on finding averages, percent of compositions, moles in chemical reactions, genotypes and...
Cherry Creek Schools
Physical Science Final Exam Review Packet
If you need a way to assess the concepts in your physical science class, use an extended set of worksheets as a midterm or final exam. It includes questions about density, physical and chemical matter, speed and velocity, weight and...
US Department of Agriculture
Sink or Float?
Will it sink or will it float? Learners predict the outcome as they drop random objects into a container of water. Then, they keep track of the results and record the data in a t-chart to draw a final conclusion.
National Wildlife Federation
Why All the Wiggling on the Way Up? CO2 in the Atmosphere
The climate change debate, in the political arena, is currently a hot topic! Learners explore carbon dioxide levels in our atmosphere and what this means for the future in the 11th installment of 12. Through an analysis of carbon dioxide...
Curated OER
How Does Water Cool?
How fast does water cool? First fifth graders will draw a line on a graph that predicts how fast they think water can cool from boiling. Then they plot the actual data on the same graph to see if their estimate was correct.
Code.org
Good and Bad Data Visualizations
Good versus bad data. Pairs rate online collections of data representations from good to bad and then suggest ways to improve the visualizations. The class then creates a list of best practices and common errors in data representations...
Radford University
A Change in the Weather
Explore the power of mathematics through this two-week statistics unit. Pupils learn about several climate-related issues and complete surveys that communicate their perceptions. They graph both univariate and bivariate data and use...
Code.org
Making Data Visualizations
Relax ... now visualize the data. Introduce pupils to creating charts from a single data set. Using chart tools included in spreadsheet programs class members create data visualizations that display data. The activity encourages...
Curated OER
Historical Pollution in the Hudson: Part 2
Ninth graders practice how to format and enter data into an Excel spreadsheet, make a graph, and interpret graphed data. They recognize how the pollution in the Hudson River has changed over time, and explain the consequences of these...
Curated OER
Go Fish!
So much science in one tiny fish! Introduce young biologists to the zebrafish, a common aquarium inhabitant. The small, unassuming organism presents an opportunity for learners to study habituation using an easy-to-care-for species. Lab...
Curated OER
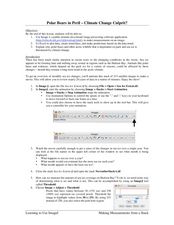
Polar Bears in Peril - Climate Change Culprit?
Learners explore the changes in sea ice over several years. In this life science lesson, students review and examine 20 years of data. They use Excel to graph data and analyze trends.
World Wildlife Fund
Graphs and Charts
A two-part worksheet incorporating bar graphs and pie charts, young mathematicians can practice their graphing skills. Pupils answer questions using graphs and charts but are also challenged to create their own using a given set of data.
Curated OER
Fishy Behavior
Here's a lab that may make you rethink that morning cup of coffee. Biology scholars test the effects of caffeine, alcohol, and nicotine on the behavior of zebrafish through an intriguing experiment. Learners observe fish behavior before...
Beyond Benign
Solubility
Enhance your class' ability to understand solubility. Science scholars examine how temperature and concentration affect solubility using an interesting lab experiment. The introduction and procedure also discuss the relationship between...
Beyond Benign
The Heat Is On
Explore an exothermic reaction with a quick lab investigation. The activity builds on the previous lessons by examining an ingredient in many shampoos. Scholars record temperature data as sodium hydroxide and water interact.
Concord Consortium
Specific Heat and Latent Heat in Condensation
There's more to melting than meets the eye! Junior physical chemists investigate the differences between specific and latent heats as a substance undergoes a phase change. Users remove heat from the system and observe changes in kinetic...
National Wildlife Federation
Get Your Techno On
Desert regions are hotter for multiple reasons; the lack of vegetation causes the sun's heat to go straight into the surface and the lack of moisture means none of the heat is being transferred into evaporation. This concept, and other...
National Security Agency
Line Graphs: Gone Graphing
Practice graphing and interpreting data on line graphs with 36 pages of math activities. With rationale, worksheets, and assessment suggestions, the resource is a great addition to any graphing unit.


