EngageNY
Modeling Riverbeds with Polynomials (part 2)
Examine the power of technology while modeling with polynomial functions. Using the website wolfram alpha, learners develop a polynomial function to model the shape of a riverbed. Ultimately, they determine the flow rate through the river.
EngageNY
Linear Equations in Two Variables
Create tables of solutions of linear equations. A lesson has pupils determine solutions for two-variable equations using tables. The class members graph the points on a coordinate graph.
EngageNY
Modeling Riverbeds with Polynomials (part 1)
Many things in life take the shape of a polynomial curve. Learners design a polynomial function to model a riverbed. Using different strategies, they find the flow rate through the river.
Rice University
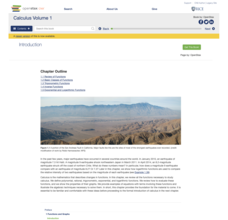
Calculus Volume 1
Differentiate between calculus concepts. The beginning of a helpful calculus resource begins with a short review of functions and moves right into limits to define derivatives. The six-chapter resource continues with applications of...
Curated OER
Interpreting Graphs
In this algebra worksheet, students interpret graphs using given data and information. They are asked to relate real world scenario using algebraic equations. There are 31 questions with a variety of topics being covered.
Illustrative Mathematics
Warming and Cooling
Is it too hot to go hiking? This task asks learners to refer to a graph that shows temperature as a function of time and answer five questions about the scenario depicted by the graph. The exercise could be used for instruction to help...
EngageNY
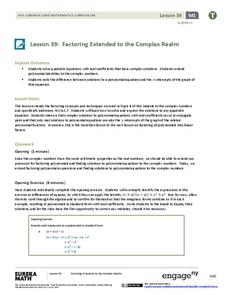
Factoring Extended to the Complex Realm
A solution will work one way or another: find solutions, or use solutions to find the function. Learners use polynomial identities to factor polynomials with complex solutions. They then use solutions and the Zero Product Property to...
Curated OER
Logistic Growth Model, Explicit Version
Via the concrete setting of estimating the population of the US, your algebra learners are introduced to a logistic growth model. Comparing and contrasting logistic, exponential, linear and quadratic models, to see which fits the data...
EngageNY
Obstacles Resolved—A Surprising Result
The greater the degree, the more solutions to find! Individuals find the real solutions from a graph and use the Fundamental Theorem of Algebra to find the remaining factors.
Charleston School District
Analyzing Scatter Plots
Scatter plots tell a story about the data — you just need to be able to read it! Building from the previous lesson in the series where learners created scatter plots, they now learn how to find associations in those scatter plots. They...
Curated OER
Linear Relations
For this linear relations worksheet, young scholars complete a table for given functions. They classify graphs as linear or non-linear. Students graph given equations. They compare and contrast graphs. This nine page worksheet contains...
Curated OER
Linear and Quadratic Approximations
Students explore a linear, a parabolic, and a log function. In this Algebra II/Pre-calculus lesson students investigate the graph a line, a parabola, and a log function. Students examine the three graphs as they compare and contrast...
Curated OER
Box Plots
Young statisticians are introduced to box plots and quartiles. They use an activity and discussion with supplemental exercises to help them explore how data can be graphically represented.
West Contra Costa Unified School District
The Extreme Value Theorem
Finding the critical numbers of a function can be extreme. The lesson introduces the Extreme Value Theorem to the class with a graph. Pupils then have an opportunity to practice determining the values using an algebraic function.
Flipped Math
Calculus AB/BC - Particular Solutions using Initial Conditions and Separation of Variables
Take the next step in separating. Pupils pick up from the previous lesson to now find the particular solution of a differential equation at a given point. Scholars watch three examples of finding the particular solution and hear the...
Curated OER
Vertical and Horizontal Translations
Pupils analyze function graphs. In this Algebra II/Pre-calculus lesson, students investigate the graph of a function as they determine to which family of functions it belongs, determine the parent function and describe the translation...
Curated OER
Types of Data
In this data chart instructional activity, students read the directions and study the examples to learn the difference between qualitative, quantitative, discrete and continuous data. Students answer 24 questions. This page is intended...
Curated OER
Nine Exercises Identifying Solution Sets to Systems of Inequalities
In this inequality worksheet, students examine graphs of functions and describe the solution set. Explanations and examples are provided. This one-page interactive, multiple choice, worksheet contains nine problems.
Curated OER
Graph of the Tangent, cotangent, Secant, and Cosecant Functions
In this college level Pre-calculus worksheet, students examine the graphs of the Tangent, cotangent, secant, and cosecant functions. Students find the intercepts and any asymptotes. The seven page worksheet contains sixty-six...
Curated OER
Practice: Word Problems
Congratulations, you've just hit the word problem jackpot! Covering an incredible range of topics from integers and fractions, to percents, geometry, and much more, this collection of worksheets will keep young mathematicians busy...
Curated OER
Trigonometry and the Calculator
In this geometry worksheet, 10th graders use a graphing calculator to evaluate trigonometric functions and their inverses. The four page worksheet contains explanation, examples, and twenty questions. Answers are not included.
Curated OER
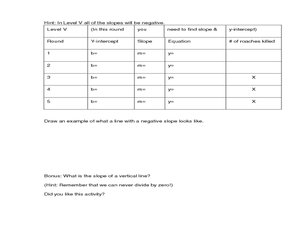
Cockroach Slope
Students identify the slope of linear functions. In this slope lesson, students collect data and graph it. They write equations with no more than two variables and use technology to explain their data.
Curated OER
Scatterplots and Regressions
In this scatterplots and regressions instructional activity, students solve 6 different types of problems related to graphing scatterplots and interpreting regressions. First, they create a scatterplot from the given data coordinates and...
EngageNY
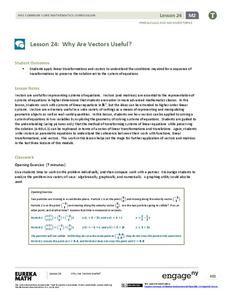
Why Are Vectors Useful? 2
Investigate the application of vector transformations applied to linear systems. Individuals use vectors to transform a linear system translating the solution to the origin. They apply their understanding of vectors, matrices,...


