Curated OER
Motion Graphs
In this motion graphs worksheet, high schoolers learn about how motion of objects can be described using a graph. Students then answer 10 fill in the blank, 10 short answer, and 5 problems to solve.
Curated OER
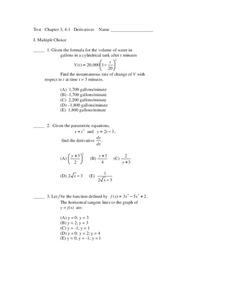
Twenty Multiple Choice and Free Response Derivative Problems
In this derivative worksheet, students solve ten multiple choice and ten free response problems. These problems include: derivatives of trig functions, tangent lines, parametric equations, and instantaneous rates of change.
Curated OER
Coordinate Plane
In this algebra worksheet, students investigate the coordinate plane through graphing, plotting and identifying the different quadrants. They identify vertical and horizontal lines in the coordinate plane. There are 10 questions with an...
Curated OER
Arkansas is Our State: Differentiating Between a State and a Country
An ambitious geography lesson is geared toward kindergartners. They discover what the differences are between states and countries. They look at maps of Arkansas, and learn what the shapes and lines mean. Additionally, they create a...
Curated OER
Rational Functions and Their Graphs
In this Algebra II instructional activity, 11th graders examine the graphs of rational functions, identifying the points of discontinuity and the vertical and horizontal asymptotes. The three page instructional activity contains...
Curated OER
Graphing Square Root and Other Radical Functions
In this worksheet, students graph the square root and other radical functions by examining the parent function and the translations and shifts that occur within the function family. The two page worksheet contains twelve problems.
Curated OER
Limits at Infinity and Horizontal Asymptotes
In this limits worksheet, students sketch the graph of a function. They complete three fill in the blank questions. Students solve fifteen limits problems. They use L'Hopital's Rule to solve four problems. Students find the vertical...
Balanced Assessment
Getting Closer
Flip the script! Reverse the situation and ask the class to find the function given asymptotes. The task requires class members to use their knowledge of functions and asymptotes to create functions that have a given asymptote or...
Curated OER
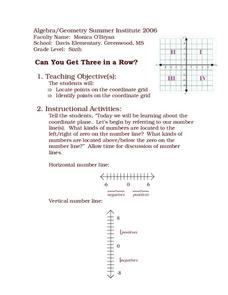
Three In a Row
Sixth graders examine how to locate coordinate points. In this coordinate graphing lesson, 6th graders locate the x and y axis. Students use their arms to show horizontal and vertical lines, participate in group and...
Alabama Learning Exchange
Jelly Beans Add Up
Students explore counting, sorting, and graphing skills. In this data analysis lesson, students sort jelly beans by color, count the jelly beans, and create a bar graph of the jelly beans according to color.
Curated OER
Graphing on a Coordinate Plane
Eighth graders explore the coordinate system. They identify the x and y-axis, parts of the coordinate plane, and discuss the process of plotting points. To emphasize the process of plotting points, 8th graders play an ordered pair...
Curated OER
Graphing X, Y, Z
Seventh graders explore how proportion controls the image of a drawing. They examine a coordinate plane and discuss plotting. Student experiment drawing an object one size, and then drawing an identical object on a different scale.
Curated OER
Shaky New Zealand
Students explore geography by answering study questions in class. In this plate tectonics lesson, students identify the earthquake data concerning the country of New Zealand and answer questions regarding the data. Students identify...
Curated OER
Writing Linear Equations in Different Forms
This activity is jam-packed with linear equations! Learners write equations in slope-intercept form and standard form. Horizontal and vertical lines are included, as well as graphs for several of the problems. A great way to...
Curated OER
Snow Cover by Latitude
Students create graphs showing the amount of snow coverage at various points of latitude and compare graphs.
Curated OER
Reflection
Eighth graders use a stencil to make a figure with which they discover the horizontal line of reflection, the vertical line of reflection, and the diagaonal line of reflection using coordinates.
Curated OER
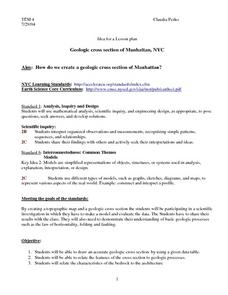
Geologic cross section of Manhattan, NYC
High schoolers draw an accurate geologic cross section by using a given data table. They relate the features of the cross section to geologic processes. Students then relate the characteristics of the bedrock to the architecture.
Curated OER
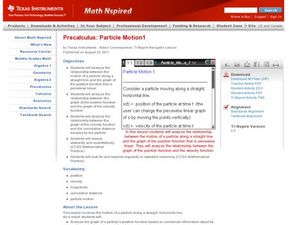
Particle Motion1
Students analyze piecewise functions. In this precalculus lesson, students identify the position, velocity and distance. They analyze the relationship between the graph, its position and velocity.
Curated OER
James and the Giant Peach Plot Analysis
It's all about the plot, main events, and story mapping with this lesson. As the class reads the novel James and the Giant Peach, they create an excitement graph that actually charts key events and moments of excitement. After...
Willow Tree
Box-and-Whisker Plots
Whiskers are not just for cats! Pupils create box-and-whisker plots from given data sets. They analyze the data using the graphs as their guide.
Noyce Foundation
Percent Cards
Explore different representations of numbers. Scholars convert between fractions, decimals, and percents, and then use these conversions to plot the values on a horizontal number line.
Curated OER
Real World Investigation- Math and Geography- Elevation Changes
In this math and geography real world investigation, 6th graders plan a driving trip to a city that is located several states away from their home while recording the elevations of three cities that are included in the trip. They use...
Curated OER
Writing Linear Equations in Different Forms
Can your class write linear equations three different ways? Here is a study guide that includes slope-intercept, standard, and point-slope forms. Learners are given the slope and a point on the line, or two points and are asked to write...
Curated OER
Coordinate Planes
Identifying the location of ordered pairs on coordinate planes is the focus in the math lesson presented here. In it, 4th graders are introduced to coordinate pairs, the x/y axis, and the techniques associated with this type of graphing....


