David Pleacher
Candy Math Fun
Few things can motivate children to learn like the promise of a sweet and tasty treat. Given a bag of M&M®s, Skittles®, or other colorful candy, students first predict the contents of the bag before counting the pieces,...
Noyce Foundation
Ducklings
The class gets their mean and median all in a row with an assessment task that uses a population of ducklings to work with data displays and measures of central tendency. Pupils create a frequency chart and calculate the mean and median....
Georgia Department of Education
Math Class
Young analysts use real (provided) data from a class's test scores to practice using statistical tools. Not only do learners calculate measures of center and spread (including mean, median, deviation, and IQ range), but...
Curated OER
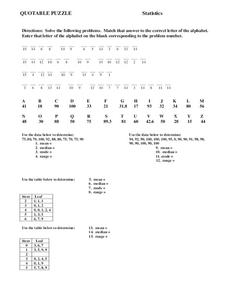
Statistics
In this statistics worksheet, 8th graders solve and complete 15 different problems. First, they solve each problem by using the data given to determine the mean, median, mode, and range for each set. Then, students match that answer to...
Curated OER
Data Analysis Self-Test
In this data analysis worksheet, students complete 1 problem that has 7 parts involving mean, median, mode, range, and quartiles. Students then perform 5 operations with matrices.
Curated OER
Measures of Central Tendencies: Quartiles
In this statistics worksheet, students calculate the mean, median, mode, range, lower quartile, and upper quartile for 10 questions and interpret a box and whiskers graph.
Curated OER
Family Size
In this family size worksheet, students complete a tally chart to determine data from a family size line plot. They organize the data in the chart to determine the mean, median, mode, and range of the data. There are six problems in...
Math Mammoth
Stem-and-Leaf Plots 3
In this stem-and-leaf instructional activity, students place statistical data in a stem-and-leaf plot. They identify the median, and range in a given set of data. There are four multi-step problems on this one-page instructional activity.
Curated OER
Representing Data 1: Using Frequency Graphs
Here is a lesson that focuses on the use of frequency graphs to identify a range of measures and makes sense of data in a real-world context as well as constructing frequency graphs given information about the mean, median, and range of...
Curated OER
Data Analysis
In these data analysis worksheets, students complete 4 worksheets of activities for analyzing data. Students use the mean, median, mode, and range to organize the data.
Curated OER
Statistics
In this statistics instructional activity, 9th graders solve and complete 8 different problems that include various measures of central tendency. First, they find the mean, median, and mode for each set of data. Then, students find the...
Math Moves U
Collecting and Working with Data
Add to your collection of math resources with this extensive series of data analysis worksheets. Whether your teaching how to use frequency tables and tally charts to collect and organize data, or introducing young...
Curated OER
Nine Examples for Tables, Pictographs, Mean. Median, and Mode
In this graphical representation of data and measures of central tendency instructional activity, students calculate mean, median, and mode and answer questions related to graphs, tables, and pictographs.
Illustrative Mathematics
Puppy Weights
Nobody can say no to puppies, so lets use them in math! Your learners will take puppy birth weights and organize them into different graphs. They can do a variety of different graphs and detail into the problem based on your classroom...
Curated OER
Fall Leaves
For this fall leaves worksheet, learners identify the colors of leaves and determine the number they have of each. This worksheet may be used in elementary grades, for color identification and counting purposes. For the middle school...
Curated OER
Survey: What Shape Has More In the Lucky Charms Box?
In this Lucky Charms worksheet, students identify the shapes in the box, and using tally marks, count how many of each shape are included. This worksheet may be used in elementary grades, for counting and tally purposes, but it also can...
Curated OER
Inequalities and Measures of Central Tendency
In this inequality and measures of central tendency worksheet, students solve and graph linear inequalities. They organize given data to identify the mean, mode and range. Students interpret box-and-whisker plots. This three-page...
Curated OER
MAP Practice
In this geometry activity, students create circle, line and bar graphs using different comparisons of events. There are 24 questions with an answer key.
Curated OER
Stem and Leaf Plots
In this stem and leaf plots worksheet, learners solve and complete 10 different problems that include designing stem and leaf plots. First, they use the table on the left to determine the least score and the range of the total scores...
Curated OER
Family Activity: Bar Graphs and Line Graphs
For this math worksheet, students work at home with a family member on a graphing activity. Students count the number of cans, glass jars, boxes and bags in the pantry. Students make a bar and a line graph to represent the data.
Curated OER
Statistics
In this statistics worksheet, students solve and complete 6 different problems that include determining various types of statistics. First, they determine the data set where the median value is equal to the mean value. Then, students use...
Curated OER
Statistics
In this statistics worksheet, 9th graders solve and complete 10 various types of problems that include using different types of graphs to illustrate data. First, they determine the median score for each stem-and-leaf plot. Then, students...
Willow Tree
Box-and-Whisker Plots
Whiskers are not just for cats! Pupils create box-and-whisker plots from given data sets. They analyze the data using the graphs as their guide.
Laboratory for Atmospheric and Space Physics
Growing Up With A Mission
New Horizons began its journey to Pluto in 2006. Ten years later, it continues its mission. In that time, scholars have surely grown, but how much more will they grow by the time New Horizons reaches its destination? Find out with an...


