Curated OER
Locating Points Using Cartesian Coordinates
Students discover coordinates as they explore Chicago. In this math lesson plan, students give the coordinates of a point, plot a point, and use the coordinate system in locating places on a map.
Curated OER
Graphing Functions
In this graphing functions instructional activity, students solve and complete 13 different problems that include identifying and graphing various functions. First, they graph each of the functions shown on the graphs provided. Then,...
Curated OER
Problem Solving: Patterns in the Coordinate Grid
Coordinate graphs can be used for a variety of purposes. In this basic worksheet on coordinate graphing, 4th graders learn how to identify points and patterns on a graph. This worksheet could be used as a follow up to a lesson on...
Curated OER
Coordinate Geometry
In this Algebra I worksheet, 9th graders identify and graph points on a coordinate plane, determine the x-and y-intercepts of a linear equation, and graph linear equations. The six page worksheet contains nineteen problems. ...
Curated OER
Coordinate Geometry
Grab your class and get them graphing polygons on a coordinate plane! They investigate the four quadrants, discover the x and y axis, and correctly plot ordered pairs. To show their comprehension, each child creates a coordinate picture...
Virginia Department of Education
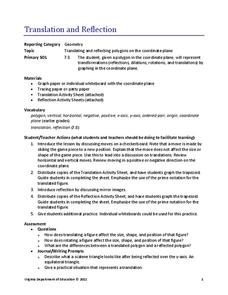
Translation and Reflection
Bring about the change you want to see in the world or at least in your lesson plans. Young mathematicians learn about translation and reflections by applying them to polygons on the coordinate plane. Results provide data to...
Curated OER
Graphing Greenery
Students gather leaves and trace them on graph paper. They plot coordinates that approximate the shape of the leaves and share those coordinates as "worksheets" for other students to complete.
Curated OER
Graphing
In this graphing worksheet, students solve and graph 10 different problems that include determining various coordinates and the slope. First, they use the table to write the x and y coordinates for each point on the graphs. Then,...
Curated OER
All Kinds of Hats Graphing Fun
Where are the hats located? A graphing activity has mathematicians finding coordinates to give exact locations of ten hats scattered on a grid. An example is done for them. Consider showing learners this skill by putting hats around...
Curated OER
Number Pairs
As you introduce graphs to young scholars, use this coordinate pairs activity to give them some independent practice. Learners examine 12 points on a graph, all of which are in the first quadrant (and therefore positive). They write the...
Concord Consortium
Rectangle Space
Take a coordinated look at rectangles. The task asks pupils to plot the length and width of created triangles in the coordinate plane. Using their plots, scholars respond to questions about rectangles and their associated points on the...
EngageNY
The Graph of a Linear Equation in Two Variables Is a Line
Show your class that linear equations produce graphs of lines. The 20th segment in a unit of 33 provides proof that the graph of a two-variable linear equation is a line. Scholars graph linear equations using two points, either from...
EngageNY
Exploring the Symmetry in Graphs of Quadratic Functions
Math is all about finding solutions and connections you didn't expect! Young mathematicians often first discover nonlinear patterns when graphing quadratic functions. The lesson begins with the vocabulary of a quadratic graph and uses...
EngageNY
Every Line is a Graph of a Linear Equation
Challenge the class to determine the equation of a line. The 21st part in a 33-part series begins with a proof that every line is a graph of a linear equation. Pupils use that information to find the slope-intercept form of the...
EngageNY
Graphs of Simple Nonlinear Functions
Time to move on to nonlinear functions. Scholars create input/output tables and use these to graph simple nonlinear functions. They calculate rates of change to distinguish between linear and nonlinear functions.
Radford University
How to Calculate and Analyze the Equation for a Parabolic Path
Working in groups, pupils plot three points on the coordinate plane representing three different parabolic paths. Using a calculator, they determine the quadratic regression equation for their models. Each team then figures out the...
Math Mammoth
Explore Graphs of Linear Equations
In this linear equation worksheet, learners graph linear equations and identify the intersection of the y-axis. There are twelve problems provided on this one-page worksheet. Coordinate planes are printed on the worksheet for the...
Curated OER
Geometry: Helix-a-Graph
Learners use geometry to create art. For this geometric graphing and patterns lesson, students create a helix-a-graph by plotting points on a grid that follow a certain pattern and analyze the drawing they created.
Curated OER
Graphing and the Coordinate Plane
Students gain practice reading coordinates and plotting points by participating in the Coordinates! Game. They demonstrate and test their skills with graph paper and the Maze Game.
Curated OER
Coordinate Graphs, Translations and Reflections
Students perform translations and reflections. In this algebra lesson, students use the TI calculator to graph functions. They move the functions around on the coordinate plane using translation and reflection.
Curated OER
Algebra I: Graphing - Lesson Plan
Twelfth graders graph ordered pairs on a coordinate plane.
Curated OER
Linear Inequalities in One and Two Variables: Rays and Half Planes
Define rays and half planes, including the concepts of boundary lines and prerequisite knowledge of coordinate planes. Given linear inequalities in one and two variables, your class will compare the differences. They will also graph...
Curated OER
Locating IIT Using Ordered Pairs
Young scholars investigate ordered pairs. In this math lesson, students plot and locate ordered pairs in a coordinate plane and are exposed to how to read and create a map.
Curated OER
Graphing
In this graphing worksheet, 5th graders identify and graph 20 different problems on the 3 different graphs shown on the sheet. First, they use the tally of callers organized by the school to complete the three different types of graphs....


