Curated OER
Snowfall Statistics for Snowboarding
Learners use the Internet to collect the current daily snowfall amounts and also to find the price of a lift ticket for snowboarding at different ski resorts in the United States.
Curated OER
Mapping with a Compass: A Simulated Survey
Students use compasses and grids to map the locations of artifacts found in a simulated dig site. In groups, they role-play as future archeologists excavating a school site. Groups begin at their assigned datum and site the artifacts...
Curated OER
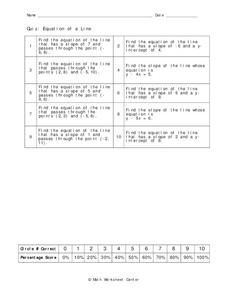
Equation of a Line
In this equation of a line worksheet, 9th graders solve 10 different problems that include the equation of a line. First, they determine the equation of a line that has a given slope and passes through a given point on a graph. Then,...
Curated OER
Reflections (2)
In this graphing worksheet, students focus on reflections. Students use rotations to create 6 geometric figures that are represented on the x or y axis.
Curated OER
Algebra 1
Young scholars study the functional relationships of a variety of problems. In this functional relationship lesson, students determine the dependent and independent quantities of a given set of data. Young scholars record the...
Curated OER
Data
Students collect data from an experiment they perform. For this data lesson, students use multiple representations to solve practical problems; describe advantages and disadvantages of the use of each representation. Then, they evaluate...
Curated OER
Real-World Linear Programming
Explore linear programming on a website game. Partners solve a real-world problem by setting up an objective function and a linear inequality. They graph their results on chart paper and also using a calculator before presenting their...
Illustrative Mathematics
Walk-a-thon 1
Your mathematician's job is to explore the relationship between hours and miles walked during a walk-a-thon. The activity compels your learners to experiment with different means in finding out this proportional relationship. The answer...
Houghton Mifflin Harcourt
Unit 8 Math Vocabulary Cards (Grade 4)
Enhance fourth graders' math vocabulary with 17 word cards and their definitions. Learners focus on terms that deal with graphing, such as y-axis, coordinates, plot, and ordered pair in the last set of math vocabulary cards.
Curated OER
Introduction to functions
In this functions worksheet, students plot points on a graph according to the rule. Students plot 7 points on each of the 2 graphs given to them.
Curated OER
Race The Rapper: Slopes
Students calculate the slope of the equation In this algebra lesson, students graph coordinate pairs of linear equations and identify the relationship between x and y values and slope. They differentiate between functions and...
Curated OER
What Is Your Point?
Sixth graders identify the x and y axes in a coordinate plane and identifies the coordinates of a given point in the first quadrant. They plot specific points in the first quadrant of the Cartesian coordinate system.
Curated OER
"If You Hopped Like a Frog" by David M. Schwartz
Students search for and generalize an algebraic pattern. They make and analyze a coordinate graph.
Geophysical Institute
Latitude and Longitude with Google Earth
Travel the world from the comfort of your classroom with a instructional activity that features Google Earth. High schoolers follow a series of steps to locate places all over the earth with sets of coordinates. Additionally, they...
Curated OER
Math 53 - Midterm 1 Review
In this math activity, students eliminate the parameter to find a Cartesian equation of the curve given by the parametric equations.
Curated OER
Slope and Parallel Lines
Students plot pairs of Cartesian coordinates on graph paper and connect points with straightedges. They examine the lines and determine if they are parallel or not by finding the equations of the lines and comparing the slopes. They...
Illustrative Mathematics
Walk-a-thon 2
During a walk-a-thon your learners must determine the walking rate of Julianna's progress. Using tables, graphs, and an equation, they must be able to calculate the time it took her to walk one mile and predict her distance based on the...
EngageNY
End-of-Module Assessment Task - Algebra 2 (Module 3)
The last installment of a 35-part series is an assessment task that covers the entire module. It is a summative assessment, giving information on how well pupils understand the concepts in the module.
5280 Math
Step by Step
One step at a time! A seemingly linear relationship becomes an entirely new type of function. Young scholars build their understanding of step functions by completing a three-stage activity that incorporates multiple representations of...
Alabama Learning Exchange
Bloodstain Pattern Doesn't Lie......
An interesting instructional activity on hypothesizing about the diameter of a drop of blood that is splattered. To test their theories, learners work in groups to make blood droplets splatter from different heights. They use graphed...
Curated OER
Carbon Monoxide and Population Density
Tenth graders investigate the carbon monoxide level at a fixed latitude. They determine if there is a relationship to population density. They download data sets and generate a graph. They determine a link between human activity and...
Curated OER
Fill the Number Grid
Patterns emerge as the class works together to fill in a number grid. This whole group activity is designed to make all learners feel successful, and ultimately turns into a lesson on the least common multiple.
Curated OER
Residential Power System
Perform data analysis on energy consumption to apply algebraic expressions to the real world. Learners will write and solve equations that answer various questions from residential power use. They will collect data at home and calculate...
Curated OER
Writing Linear Equations in Different Forms
Can your class write linear equations three different ways? Here is a study guide that includes slope-intercept, standard, and point-slope forms. Learners are given the slope and a point on the line, or two points and are asked to write...


