Curated OER
Free African-Americans in Delaware
Students work in groups of two and review the Abolitionist Movement. They observe the manumission/city directory and discover what it is and why it is so important. They read the manumission aloud and discuss why they were freeing their...
Curated OER
TE Lesson: Caught in the Net
Students student the concept of bycatch, the act of unintentionally catching certain living creatures using fishing equipment. They determine the difference between bycatch and target creatures. They discover what species become bycatch...
Curated OER
Gwynns Falls
Students investigate the question: What is the impact of urban development and expansion on the health of a decidious forest ecosystem and humans? They examine the issue of land development by responding to a specific scenario and...
Curated OER
Decomposers at Work!
Students design and conduct investigations that illustrate the process of decomposition. After a lecture/demo, students simulate the process of soil composting in the classroom. They closely chart the decomposition of their soil.
Curated OER
Bioremediation
Students design and conduct investigations that illustrate the effect bioremediation has on organic matter and determine environmental applications. They, in groups, present their findings to the class.
Curated OER
Changes Close To Home
Students interview the senior citizens in their community. While interviewing them, they identify perceptions they have about the local climate. Using the internet, the compare the results of the interview to those of public thirty...
Curated OER
Genetic Disease Pamphlet
Students design a pamphlet to inform and educate people about an inherited disease or disorder.
Curated OER
Whose Business?
Fourth graders compare and contrast the businesses in Fort Griffin with those in their own community. Using the internet, they discover the factors that have influenced the development of businesses in a town. They also create a map of...
Curated OER
What's the Problem?
Fourth graders redefine the problem of Where's the Heart of Florida? and begin to formulate possible solutions using graphic organizers.
Curated OER
Site vs. Situation: Location! Location! Location!
Students examine places with a similar latitude to Alabama, and discuss the importance of a location's site versus its situation. They analyze maps, create a chart, and write a paragraph on the difference between site and situation.
Curated OER
Relating Number of Insect Species to Water Quality
Students are asked to respond to questions such as:" Have there been surveys of the area to inventory the species?" (For example, for a wetland area, do they know what amphibians live there and how abundant they are?) Are there any...
Curated OER
One Square Meter
Learners explore the concept of a quadrat study. Students select and investigate a site and conduct a quadrat survey. They take measurements, observe the area and analyze their findings.
PBS
Pbs Teachers: Tree Mendous Plots [Pdf]
To teach students how to use collect and use real-life data, use this lesson to create, populate and analyze graphs to interpret data related to the growth of plants from seeds. The lesson then asks students to create a story about the...
Illustrative Mathematics
Illustrative Mathematics: F if a Sse Modeling London's Population
In this task, students are shown a table of population data for the city of London and are asked to explore whether a linear, quadratic, or exponential function would be appropriate to model relationships within the data. They are next...
PBS
Wnet: Thirteen: Ed Online: Growing, Growing, Graphing!
Students explore the growth population of China and use graphs and equations to display data.
BSCS Science Learning
Bscs: Frog Eat Frog World
Using maps and graphs of large data sets collected in FrogWatch, students will determine the range, preferred land cover, and proximity to water of the American bullfrog to figure out the bullfrog's requirements for food, water, and...
Illustrative Mathematics
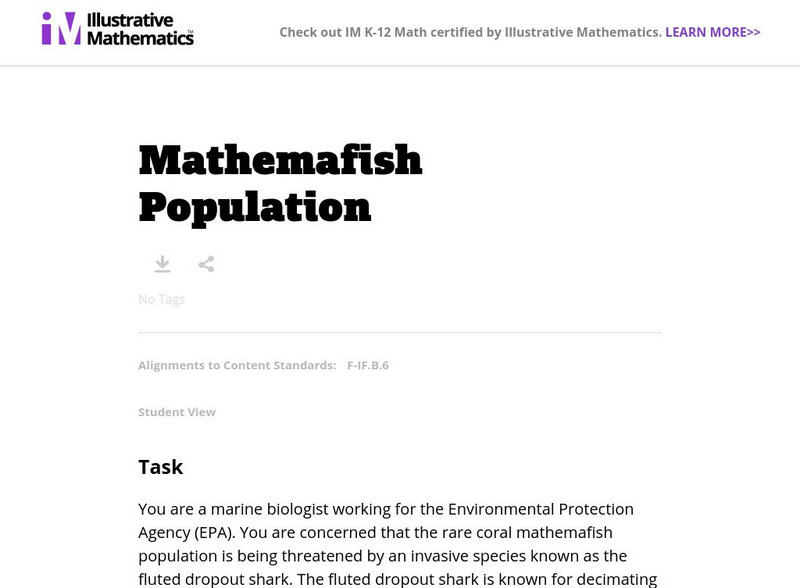
Illustrative Mathematics: F If.6 Mathemafish Population
For this task, learners are presented with a table and a graph and are asked to summarize the data and report the findings of a project by the Environmental Protection Agency to contain the effects of an invasive species on a fish...
Science Education Resource Center at Carleton College
Serc: Determining Bird Populations Through Counting
Students participate in a bird count to determine the number of birds sighted in four different sites. Students draw inferences from recorded data on a bar graph in regard to the number of species in the area and relative population size.
BSCS Science Learning
Bscs: Global Night Sky Comparison
This inquiry invites students to investigate human impacts on the environment. Specifically, students will examine the relationship between human population, light pollution, and how brightly celestial objects like stars appear in the...
Climate Literacy
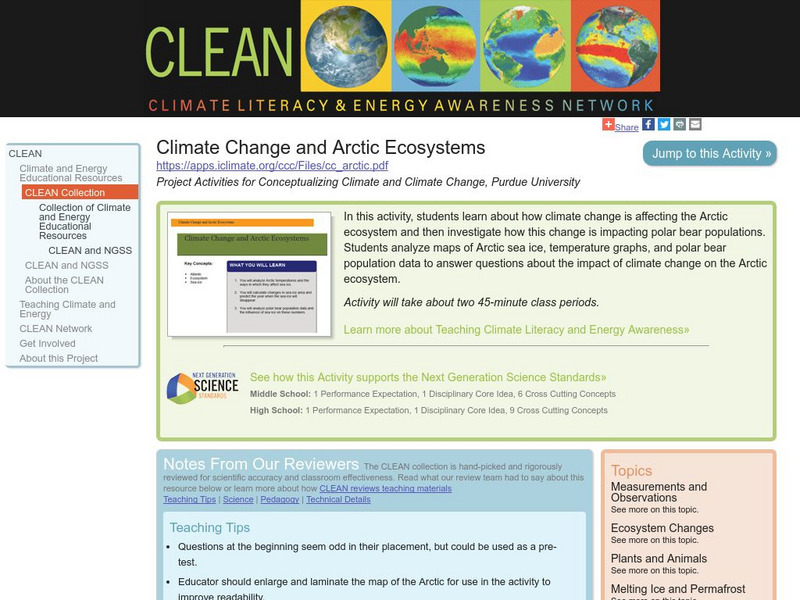
Clean: Climate Change and Arctic Ecosystems
Students learn about how climate change is affecting the Arctic ecosystem, and then investigate how this change is impacting polar bear populations. Students analyze maps of Arctic sea ice, temperature graphs, and polar bear population...
Science Education Resource Center at Carleton College
Serc: Investigating the Ecology of Goldenrod Galls Through Biological Sampling
In this biology field lab exercise, students conduct a stationary population study of goldenrod galls. They examine a host of factors including goldenrod plant density, goldenrod gall density, gall height, gall mass, larval exit hole...
Science Education Resource Center at Carleton College
Serc: Eagles in the Ecosystem Classroom Jigsaw Activity
In this in-depth jigsaw activity, students investigate the role bald eagles play in the ecosystem, why they were listed as endangered, the effects of DDT on eagles, and the effects of lead on eagles. Furthermore, students will then graph...
Alabama Learning Exchange
Alex: My Peanut Butter Is Better Than Yours!
The students will engage in the process of statistical data comparing data using tables and scatterplots. The students will compare data using measures of center (mean and median) and measures of spread (range). This lesson can be done...
Other
Statistics Education Web: Bubble Trouble [Pdf]
Use random sampling to formulate, collect, and compare data from two populations. Written by Peter Banwarth of Oregon State University.


![Pbs Teachers: Tree Mendous Plots [Pdf] Lesson Plan Pbs Teachers: Tree Mendous Plots [Pdf] Lesson Plan](https://content.lessonplanet.com/knovation/original/114247-36948766618258b08210c17f84fd1d88.jpg?1661419217)


![Statistics Education Web: Bubble Trouble [Pdf] Lesson Plan Statistics Education Web: Bubble Trouble [Pdf] Lesson Plan](https://content.lessonplanet.com/knovation/original/715465-988c4be74f96df36c2d9bcb6f2f5182f.jpg?1661829195)