Curated OER
Epidemiology: Graphing and Analyzing Health Data
Students graph data on fetal and infant mortality rates collected by the Centers for Disease Control and Prevention. They identify trends in the data and propose potential causes for the trends.
Curated OER
Deciding Which Type of Graph is Appropriate
In this graphing instructional activity, students read about line, bar, and pie graphs and then determine which graph is the best way to express data results. This instructional activity has 3 short answer questions.
Curated OER
Ashes to Ashes: Using Evaporation Rate to Identify an Unknown Liquid
Learners explore the concept of evaporation rates in this evaporation rates lesson plan. They will try to identify the chemical that began a fire, perform an experiment where they use the evaporation rates to determine the unknown...
Curated OER
Beverage Tests
Learners investigate the pH of a liquid. In this middle school mathematics/science lesson, students collect and analyze data regarding the pH of various liquids. Learners display their data in various types of graphs as they consider...
Curated OER
Mystery Liquids: Linear Function
High schoolers determine the linear equations of the density of water and oil by collecting data on the mass of various volumes of each liquid. They construct scatter plots from the data and use these to write the linear equations for...
McGraw Hill
Population Biology
The carrying capacity of an environment varies based on the organisms that live there. Using a virtual lab simulation, scholars test two protists living in their own environments and a third environment where both protists live. They...
Curated OER
The Effect of Dissolved Salt on the Boiling Point of Water
Explore the properties of solutions with a lab activity. Chemistry fans determine the boiling point of water, add salt to create a solution, and then repeat the process four more times. They design their own data table and then graph the...
Curated OER
Quadratic Equations with the CBL 2
Learners practice generating parabolas with a motion sensor while determining the vertex form of the equation. They compare it to the regression equation from the calculator onto a data mate software. Each student completes several...
Rainforest Alliance
Climate Educator Guide
Climate change is a hot topic in the news. Class members examine carbon dioxide data to analyze trends of our atmospheric makeup over time. They also discuss climate and climate change, and determine how these changes are affecting life...
Curated OER
Introduction to Graphs: Bar Graphs, Line Graphs, Circle Graphs
In this graphing data worksheet, students answer 5 short answer questions about graphs. Students determine which type of graph best represents various data sets.
Curated OER
Weather "Whys"
Students explore the weather. In this weather data lesson, students collect weather data from Internet and media sources. Students graph the collected data discuss it as well as the seasons of the year.
Curated OER
Using Radiosonde Data From a Weather Balloon Launch
Student use radiosonde data from a weather balloon launch to distinguish the characteristics of the lower atmosphere. They learn the layers of the atmosphere. They graph real atmospheric data.
Curated OER
Locating Vent Fields Using CTD Data
Students describe the way hydrothermal vents work. Students work on locating vent regions through remote collection of data about water temperature and density. Comparing density and temperatures graphs, students search for indicators...
Curated OER
Diffusion & Osmosis with Data Analysis
Pupils explore principles governing diffusion and osmosis. Students perform a dialysis tubing experiment. They obtain core samples of potato in varying concentrations of sugar-water to measure water potential of the potato cells. Data...
Polar Trec
Who Will Melt First?
If the Greenland ice sheet melted, sea levels would rise by about 20 ft; if the Antarctic ice sheet melted, sea levels would rise by 200 ft. Scholars explore ice melting through the analysis of different ice samples, clean and dirty ice....
Teach Engineering
Energy Perspectives
The data says ... the resource is great to use. Using Microsoft Excel, pupils analyze data from the US Department of Energy in the fifth lesson of a 25-part Energy Systems and Solutions unit. Each group looks at a different data set and...
Teach Engineering
Preconditioning Balloons: Viscoelastic Biomedical Experiments
What does stretching a balloon have to do with equilibrium? Groups explore preconditioning by stretching a balloon to a point of equilibrium. They then measure the amount of force required to stretch the balloon to the same point several...
Cornell University
Mechanical Properties of Gummy Worms
Learners won't have to squirm when asked the facts after completing an intriguing lab investigation! Hook young scholars on science by challenging them to verify Hooke's Law using a gummy worm. Measuring the length of the worm as they...
Shodor Education Foundation
Box Plot
What information can come from a box? Learners choose a data set to display as a box plot and decide whether to include the median in the calculation of the quartiles, show the outliers, and change the scale. To finish the lesson,...
NASA
Newton Car
If a car gets heavier, it goes farther? By running an activity several times, teams experience Newton's Second Law of Motion. The teams vary the amount of weight they catapult off a wooden block car and record the distance the car...
Howard Hughes Medical Institute
Population Genetics, Selection, and Evolution
The Hardy-Weinberg principle states that alleles and genotypes remain constant in the absence of evolutionary influences. Scholars complete a simple hands-on activity applying the Hardy-Weinberg principle to sample data. They observe how...
Curated OER
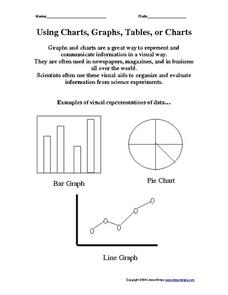
Using Charts, Graphs, Tables, or Charts
In this charts, graphs and tables activity, students view 3 different types of visual representations of data, make a list of 20 items and decide how the items can best be put together in groups to make a graph, chart or table. Students...
Curated OER
Beans and Baleen
Predict whale populations using different beans as whales! Learners observe different types of beans in a dish knowing that each bean represents a different kind of whale. They then predict how many "whales" there are in a certain area....
Columbus City Schools
Totally Tides
Surf's up, big kahunas! How do surfers know when the big waves will appear? They use science! Over the course of five days, dive in to the inner workings of tidal waves and learn to predict sea levels with the moon as your guide.


