Museum of Tolerance
Where Do Our Families Come From?
After a grand conversation about immigration to the United States, scholars interview a family member to learn about their journey to America. They then take their new-found knowledge and apply their findings to tracking their family...
Curated OER
Digestion & Nutrition: a Case Study
Students explore digestion/nutrition and utilize scientific investigation skills. They complete meal logs for several days and graph their results. After analyzing their data, they write formal lab reports.
Curated OER
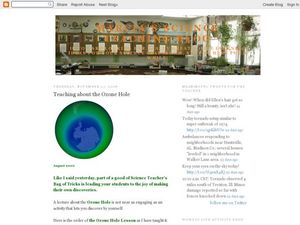
Teaching About the Ozone Hole
A PowerPoint and an accompanying worksheet introduce young meteorologists to the hole in the ozone layer. Another handout provides a coloring and graphing activity which examines the changes in the ozone. There are also links to neat...
Virginia Department of Education
Weathering of Limestone
We all know limestone weathers, but what affects the rate of weathering? Young scientists investigate the physical and chemical weathering of limestone (chalk) through experimentation. First, they conduct trials with different-size...
Curated OER
2nd Grade - Act. 23: Sprout Houses
Read the story "Sunflower House," by Eve Bunting with your 2nd graders to investigate the relationships between plants and animals. They will discover how living things change during their lives by creating their own sprout houses. In...
Curated OER
Come On Down!
Begin with an introduction to famous deep-sea submersibles. Learners work in groups to gather information on different vessels and then share with the class. Each group then uses water displacement to help calculate the density of...
Curated OER
Greenhouse Gases
Although the worksheet for the lab activity is not included, this is an activating activity for your class to do when learning about the greenhouse effect. They lay three thermometers underneath a lamp: one out in the open, one under a...
Curated OER
Elastic Recoil in Arteries and Veins
A lab in which high schoolers examine the difference between arteries and veins. Budding biologists will find out which blood vessel can stretch furthest, recording their data in a table then answering several questions evaluating their...
Curated OER
Sunspot Graphing
Students, using 15 years of sunspot data, plot data on a classroom graph. They discuss why the pattern from their individual sheets did not and could not match the class graph.
Curated OER
The Statistical Nature of Test Data
Students investigate the properties of various metals. They conduct an experiment and gather the data by putting into the proper statistical graphs. The data is analyzed and conclusions are formed according to the properties of the metals.
Curated OER
Take a Walk
Sixth graders graph acceleration and practice using the metric system. In this physics lesson, 6th graders take turns timing each other as they walk 15 meters. Students then chart and graph their data using the metric system.
Curated OER
Activity Three Teacher Page: Collisions
Students after completing this lesson, identify variables that affect the system, and specify which variables are independent; which are dependent. They represent data in a data table and a graph and analyze data and make predictions.
Curated OER
The "Clock Reaction" Kinetics Lab
Students investigate the effects of temperature and concentration on the rate of reactions. In this "clock reaction" kinetics lesson plan, students change the concentration of one reactant and keep the second constant. An indicator is...
Curated OER
Static Electricity - Grocery Store Items
Students investigate static electricity using inexpensive "grocery store" items. They view demonstrations with video segments. They graph the data they collect.
Curated OER
Exponential Decay
Students study exponential decay and its application to radiocarbon dating. In this exponential decay lesson, students use candy to model the time it takes for something to decay. Students also graph the data they collect and describe...
Curated OER
Structure of Seeds and Effects of Fertilizer on Plant Growth
Investigate the structure of seeds and the effects of fertilizer on the growth of plants. Young scientists observe a peanut and determine if it is a monocot or dicot plant. They plant seeds and make varying solutions of fertilizer, then...
Curated OER
Comparing Linear and Exponential Data
Learners graph linear and exponential equations. In this algebra instructional activity, students differentiate between linear and exponential equations. They relate it to the real world.
Curated OER
A Life to Remember
Students test and discuss their ability to remember events in their recent and past history and reflect on cases of dissociative fugue and amnesia. They graph and analyze data to look for patterns in the ability to recall a list of...
University of Georgia
Energy Content of Foods
Why do athletes load up on carbohydrates the evening before a competition? The lesson helps answer this question as it relates the type of food to the amount of energy it contains. After a discussion, scholars perform an experiment to...
Curated OER
Who Lives in the Water? Stream Side Science
Andree Walker thought of everything when he wrote this resource. It includes a detailed list of materials and background information links for the teacher. In addition, it has procedures, a macroinvertebrate identification key, and tally...
Science 4 Inquiry
A Whole New World: The Search for Water
Scholars find Earth won't support humans much longer and need to identify a planet with water to inhabit. They test four unknown samples and determine which is the closest to water. Then they explain and defend their results.
Curated OER
"Croak" Science Mystery
Solve the mystery of a declining frog population! Lead your junior ecologists on an investigation that simulates actual events concerning pollution, predation, poaching, and more. Investigators read a story online, then analyze survey...
Code.org
Encoding Color Images
Color me green. The fourth lesson in a unit of 15 introduces the class to color images and how to encode color images using binary code and hexadecimal numbers — and they will quickly notice that it is easier to code the color for each...
University of Minnesota
Do the Stroop
The Stroop test helps diagnose executive function disorders when used in conjunction with other tests. Reading color words and identifying colors seem like basic skills, but the Stroop test may show otherwise. Scholars work with a...


