NASA
Development of a Model: Analyzing Elemental Abundance
How do scientists identify which elements originate from meteorites? Scholars learn about a sample of material found in a remote location, analyzing the sample to determine if it might be from Earth or not. They study elements, isotopes,...
Beyond Benign
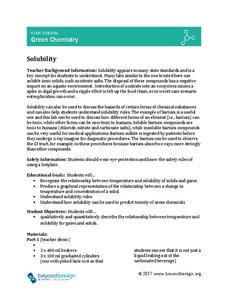
Solubility
Enhance your class' ability to understand solubility. Science scholars examine how temperature and concentration affect solubility using an interesting lab experiment. The introduction and procedure also discuss the relationship between...
Constitutional Rights Foundation
Purged From the Voter Rolls: Husted v. A. Philip Randolph Institute
Once a registered voter isn't always a registered voter. Academics explore the topic of voter registration and hindrances to remaining registered. The resource focuses on data analysis, federal voter registration law, and Supreme Court...
Science 4 Inquiry
States and Phases of Matter
Plasma is the most common phase of matter in our universe. Scholars explore the change of energy as molecules change phases of matter. They rotate through stations, graphing the changes in energy level.
Cheetah Outreach
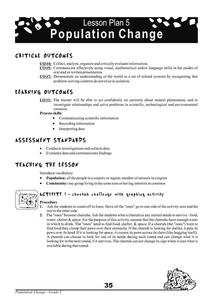
Population Change
Your youngsters become cheetahs in search of food, water, shelter, and space in a fun physical game that does a fantastic job of representing fluctuating species population based on resources available over years.
Oregon State
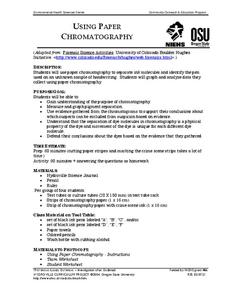
Using Paper Chromatography
Through the analysis of paper chromatography to separate ink from the pen found at the crime scene, learners analyze the different stains and through calculations determine the thief.
University of Pennsylvania
Evolution by Natural Selection
A diagram, data table, and reading passage top this resource. Through it, biology beginners are introduced to the concept of natural selection. They answer some questions and then participate in a simulation using fabric as a habitat and...
Curated OER
Solar Kit Lesson #7 - Positioning Solar Panels I: Explorations with Tracking
In this first part of a two-part lesson, learners track and record the sun's azimuth using a solar panel. They graph and analyze the data to identify relationships among the time of day, the altitude and azimuth of the sun, and the...
Curated OER
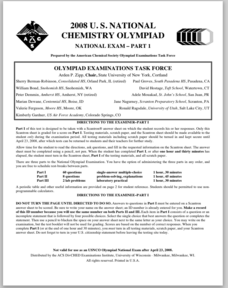
2008 U.S. National Chemistry Olympiad Part I
In this chemistry Olympiad worksheet, students solve sixty multiple choice questions on a variety of chemistry topics from finding molarity of solutions to calculating products of reactions. Students are given graphs, equations, reaction...
PhET
Radioactive Dating Game
Uranium 235 has a half-life of over 700 million years and is the fuel used in the atomic bomb dropped on Hiroshima, Japan. Pupils see the half-lives and decay rates of Carbon-14 and Uranium-238. They also take measurements of these two...
Curated OER
The Frozen Desert: Graphing and Comparing Climates
Students explore the concept of climate. They use temperature and precipitation data from their area and other regions to construct climate graphs. These graphs are used to help identify factors that influence climate.
Curated OER
Weather
Students create a spreadsheet and chart using data collected. In this weather lesson, students select five cities from their state, including the city they live in. Students take daily temperature readings from all five cities. ...
Alabama Learning Exchange
Keep It Movin'!
Learners conduct an experiment to study friction. They complete a KWL chart on friction and conduct an activity about the amount of friction on a moving object. To conclude, pupils create a table or graph of the data collected and they...
Curated OER
Lessons for Atlatl Users with Some Experience-Grade 6
Sixth graders experiment with an atlatl and dart. In this sixth grade data management mathematics instructional activity, 6th graders explore and determine the most suitable methods of displaying data collected from their...
Curated OER
Paper Airplane Science
Fifth graders recognize the need to follow the scientific method carefully and be aware of variables in experiments. In this airplane lesson, 5th graders design and test an airplane, and complete a data sheet. Students retest five times...
Curated OER
Conservation of Mass
In this conservation of mass worksheet, students design an investigation to demonstrate the Law of Conservation of Mass. Students describe their investigation, collect data, graph the data and write a conclusion about what they discovered.
Curated OER
Graphing Weather
Students make a graph. In this weather lesson plan, students fill in a KWL chart about different types of weather. Students watch a PowerPoint presentation about weather and natural disasters and where these types of weather are common....
Curated OER
How Much Water Is Available In The Atmosphere For Precipitation?
Students explore the relationship between the available water in the atmosphere and how it is portrayed on satellites. After examining global moisture and precipitation students research precipitation data graph the results. Using their...
Curated OER
Graphing Ozone Chemistry: Introduction
Learners discuss Ozone Chemistry. They do research on the subject. They graph their data. They analyze the economic impact of removing CFC's from the biosphere, and graph the worldwide production of CFC's since their discovery.
Curated OER
Reading Frequency Tables
In this data interpretation instructional activity, students record the data from 10 examples into frequency tables. They group 10 more data sets, and make a frequency table for each.
Curated OER
Gathering, Recording, and Presenting Data
Sixth graders use the local newspaper to find and discuss examples of uses of statistics and the ways in which the information is presented. They create and represent their own set of data showing how students get to school each day.
Curated OER
Show Me!
Students analyze and interpret graphs. In this graphing lesson, students view a video and construct their own graphs (line, circle, bar) from given sets of data.
Curated OER
Graphing Data from the Chemistry Laboratory
Students graph and analyze data using a spreadsheet.
Curated OER
The Blizzard of 1993
Students read and interpret the information from a barograph from a major winter storm. This task assesses students' abilities to interpret and analyze graphs, construct data tables and graphs, generalize, infer, apply knowledge of...


