Curated OER
Bouncing Ball
Students collect height versus time data of a bouncing ball using the CBR 2™ data collection device. Using a quadratic equation they graph scatter plots, graph and interpret a quadratic function, apply the vertex form of a quadratic...
Museum of Tolerance
Where Do Our Families Come From?
After a grand conversation about immigration to the United States, scholars interview a family member to learn about their journey to America. They then take their new-found knowledge and apply their findings to tracking their family...
Curated OER
The Parachute
Students discuss parachutes and write a procedure to determine the effect of different size parachutes and different masses on the time it takes the masses to fall. They record all their data from their experiment then write three...
Curated OER
Season Worksheet #5
Sunrise, sunset, swiftly fly the years! Your earth scientists can also fly through a year of daylight data. They analyze a graph and then answer five multiple choice questions about the rising and setting of the sun, the total number of...
It's About Time
Coal and Your Community
When I was young, I was afraid of the dark. Now I am afraid of getting the electric bill. This fourth lesson in a series of eight focuses on coal mining, conservation, and energy efficiency. Scholars start by taking data from a table and...
Curated OER
Unit II Worksheet 4 - Constant Velocity/Motion Maps
This is a smart approach to displacement concepts. Physics learners analyze a motion map and then draw qualitative graphs for time versus displacement and time versus velocity. Get your class thinking critically through the use of a very...
Curated OER
Digestion & Nutrition: a Case Study
Students explore digestion/nutrition and utilize scientific investigation skills. They complete meal logs for several days and graph their results. After analyzing their data, they write formal lab reports.
College Board
2018 AP® Biology Free-Response Questions
The average AP Biology score dropped in 2018 with the addition of more data tables and graphs. Offer additional practice free-response questions by using the questions from the 2018 AP exam covering phylogenetic trees, cell structure and...
Curated OER
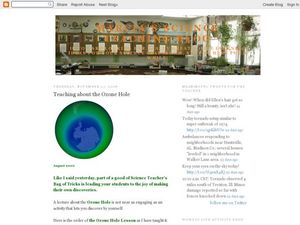
Teaching About the Ozone Hole
A PowerPoint and an accompanying worksheet introduce young meteorologists to the hole in the ozone layer. Another handout provides a coloring and graphing activity which examines the changes in the ozone. There are also links to neat...
Virginia Department of Education
Weathering of Limestone
We all know limestone weathers, but what affects the rate of weathering? Young scientists investigate the physical and chemical weathering of limestone (chalk) through experimentation. First, they conduct trials with different-size...
Curated OER
2nd Grade - Act. 23: Sprout Houses
Read the story "Sunflower House," by Eve Bunting with your 2nd graders to investigate the relationships between plants and animals. They will discover how living things change during their lives by creating their own sprout houses. In...
Curated OER
Come On Down!
Begin with an introduction to famous deep-sea submersibles. Learners work in groups to gather information on different vessels and then share with the class. Each group then uses water displacement to help calculate the density of...
It's About Time
Petroleum and Your Community
I was going to write a joke about oil, but it seemed crude. This lesson starts with a comparison of where the US gets oil from and how that has changed over time. After analyzing the data, scholars create a graph and use the Internet to...
Curated OER
Greenhouse Gases
Although the worksheet for the lab activity is not included, this is an activating activity for your class to do when learning about the greenhouse effect. They lay three thermometers underneath a lamp: one out in the open, one under a...
Curated OER
Elastic Recoil in Arteries and Veins
A lab in which high schoolers examine the difference between arteries and veins. Budding biologists will find out which blood vessel can stretch furthest, recording their data in a table then answering several questions evaluating their...
CK-12 Foundation
Going Fishing
Why do some things float and others sink? A creative simulation allows learners to adjust mass and volume of an object to affect its buoyancy in water. A graph records the effect of each manipulation.
Concord Consortium
Double Pendulum
What's better than a pendulum for studying motion and periods? A double pendulum! Young physical scientists use an interactive to explore pendulum motion—times two. The resource boasts a host of parameters to change and a running graph...
Science Matters
Formative Assessment #2: Circulatory System Performance Assessment
Watch as your pupils' hearts get pumping! An interactive activity has individuals record their heart rates after completing different activities. Each task has a different degree of physical activity. They then graph their results and...
Curated OER
Sunspot Graphing
Students, using 15 years of sunspot data, plot data on a classroom graph. They discuss why the pattern from their individual sheets did not and could not match the class graph.
Curated OER
The Statistical Nature of Test Data
Students investigate the properties of various metals. They conduct an experiment and gather the data by putting into the proper statistical graphs. The data is analyzed and conclusions are formed according to the properties of the metals.
Curated OER
Take a Walk
Sixth graders graph acceleration and practice using the metric system. In this physics lesson, 6th graders take turns timing each other as they walk 15 meters. Students then chart and graph their data using the metric system.
Curated OER
Activity Three Teacher Page: Collisions
Students after completing this lesson, identify variables that affect the system, and specify which variables are independent; which are dependent. They represent data in a data table and a graph and analyze data and make predictions.
Curated OER
The "Clock Reaction" Kinetics Lab
Students investigate the effects of temperature and concentration on the rate of reactions. In this "clock reaction" kinetics lesson plan, students change the concentration of one reactant and keep the second constant. An indicator is...
Curated OER
Static Electricity - Grocery Store Items
Students investigate static electricity using inexpensive "grocery store" items. They view demonstrations with video segments. They graph the data they collect.


