National Security Agency
It's Probably Probable
Learners make predictions and draw conclusions from given information as they learn the meaning of probability in this vocabulary-rich, integrated activity that presents a variety of teaching strategies to motivate and reach all learning...
Curated OER
Tulip Graphing
Students create a graph of tulip growth. In this data analysis lesson, students plant tulip bulbs and use graph paper to begin graphing data on the growth of the tulip.
Curated OER
Weather Patterns
Fourth graders collect and chart weather data over the course of the school year either using tools at school or media resources. They agree on weather terms to use in their observations and write them on the assigned sheet. Finally,...
Curated OER
Halloween Graphitti
Students complete multi-curricular activities in a Halloween themed lesson. In this Halloween lesson, students examine newspaper ads to find prices of pumpkins and use them to complete a stem and leaf plot. Students find the diameter,...
Curated OER
Results and Conclusions
Fourth graders practice using the scientific method. In this results and conclusions lesson, 4th graders review data collected, create a graph of their data and make their final conclusions about the information collected.
Curated OER
Squares in the Light
Students collect and analyze data using a graph. In this algebra lesson, students explain their findings orally and with a graph. They use their knowledge to solve real life scenarios.
Curated OER
Nuclear Chemistry Homework Problem Set
In this nuclear chemistry worksheet, students evaluate data from concentration experiments on radioactive iodine. They graph the data, determine radioactive decay and half life for the element.
Beyond Benign
Water Bottle Unit
How much plastic do manufacturers use to create water bottles each year? The class explores the number of water bottles used throughout the years to determine how many consumers will use in the future. Class members compare different...
Cornell University
Sound Off!
Time to witness the effects of sound. Learners analyze different materials to determine their abilities to absorb sound waves. They use free software to monitor the amplitude of the waves to verify results.
Curated OER
Parts of a Plant
First graders discover the parts of a plant. In this science instructional activity, 1st graders identify and label the parts of a plant and record their findings on a word processor.
Curated OER
Acceleration Science
In collaborative groups, physics learners design and create a web portfolio of internet resoucres explaining poitive and negative acceleration, zero acceleration, and positive and negative velocity. This is a terrific assignment for...
Sea World
Splash of Math
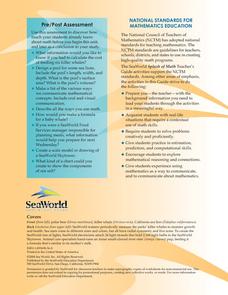
How can kids use math to learn about marine life? Combine math skills with science lessons in a resource featuring activities about life in the sea. Kids graph and calculate data, solve complex word problems, measure geometric shapes,...
National Park Service
Weather Patterns of the Pacific Ocean
How do oceans affect weather patterns? Learners define vocabulary associated with dew point, topographical lifting, condensation, and formation of clouds and precipitation as they explore the weather in the Pacific Northwest. They also...
Curated OER
Graphing the Elephant Seal Population Data
Young scholars are able to graph data that they generated in the elephant seal exercise using proper format and labeling. They are able to interpret the graphs they created and make A) conclusions, and B) predictions based on that graph.
Curated OER
Patterns of Evolution and Selection
Can your young biologists interpret population graphs, match macroevolution patterns and descriptions, and answer multiple choice questions about evolution? Find out with a comprehensive three-page quiz covering some specific examples of...
Curated OER
Rain Forests: A Disappearing Act?
Students examine and locate rainforests on maps, and research the patterns of their destruction. They develop a bar graph of rainfall and temperature data, write a journal entry, and research the people, animals, and plants/products of...
Michigan Sea Grant
What's in This Water?
Pupils investigate the biological and chemical characteristics of water to determine where purple loosestrife occurs. They create data sheets to record water quality tests in several locations and work in groups to conduct the water...
Curated OER
What's Cooking?
Students investigate solar energy by making sun tea. In this ecology and solar energy lesson, students prepare traditional tea and "sun" tea, then record and graph data comparing color, clarity, smell and taste.
Curated OER
Blast Off
In this physical science exploration, small groups place a piece of antacid tablet into a film canister and step back to time how long it takes for the top to pop. They repeat the activity, altering either the amount or temperature of...
Curated OER
Acceleration 1
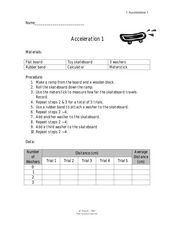
In this acceleration worksheet, students use weights to increase the mass affecting the force on moving objects. Students plot a graph of their data and answer 3 questions about how the acceleration of the toy skateboard used in the...
Curated OER
Graphing the Standard Curve
Learners analyze colorimetric using a computer program. In this science lesson, students show application of standard curves by finding other areas of science where standard curve is analyzed.
Curated OER
Analysis of Atmospheric Conditions for a High Mountain Retreat
Students examine the relationship between altitude, atmospheric pressure, temperature and humidity at a particular location. They practice science and math in real world applications. They write reports detailing their scientific...
Texas Instruments
Data Collection for Bar Graphs
Learners study the concept of central tendency in this data collection for bar graph lesson. They collect data outside as instructed and organize it into a bar graphs, then they list in specific groups the labels that appear on the...
Curated OER
Measuring Transpiration
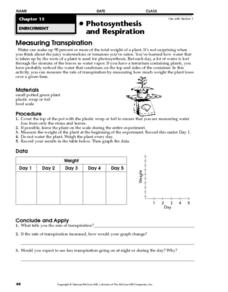
In this transpiration worksheet, students will conduct an experiment to measure the rate of transpiration from a plant by measuring how much weight the plant loses over 5 days. Students will record their data and create a graph of the...


