Curated OER
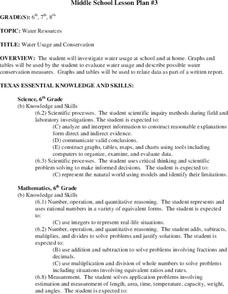
Water Usage and Conservation
Pupils investigate water usage at school and at home. They use graphs and tables to evaluate water usage. Students describe possible water conservation measures. They use graphs and tables to relate data as part of a written report.
Curated OER
Water - Planning for the Future
Students explore and examine the increases and/or decreases for water user groups: irrigation, municipal, manufacturing, steam electric power generation cooling, livestock, and mining. They utilize percentage changes during their...
Curated OER
Living in the Desert
Conduct an investigation on the plants used by the Hohokam tribe. To survive in the harsh desert environment the Hohokam used many natural resources. Learners read, research, map, and graph multiple aspects of Hohokam plant use as a...
Curated OER
Height of Bounce
Eighth graders determine the relationship between the height of bounce of a ping-pong ball and the height from which it was dropped. They are assessed on the ability to record and interpret data, graph data, make predictions, and make...
Curated OER
Primary Biological Content Area Covered
Students use the scientific method to make predictions about mold growth. For this fungus lesson, students use worksheets to help them illustrate predictions and graph mold growth from white to wheat bread. Students first...
Curated OER
Will There be Enough Water?
Students investigate water usage, water available, and water demand historically in the local area. They use projections of water usage, availability and demand up to the year 2050. Students use graphs to relate as well as compare and...
Curated OER
Introducing Linear Terminology
Ninth graders graph linear equations and inequalities in two variables and then, they write equations of lines and find and use the slope and y-intercept
of lines. They use linear equations to model real data and define to define the...
Curated OER
Crustal Sinking
Students measure the rate of sinking of a test tube into a beaker of "glop", representing a model of the interaction between the Earth's crust and upper mantle. This task assesses students' abilities to make simple observations,...
Curated OER
Balsa Wood Airplane Flight and Speed Correlation
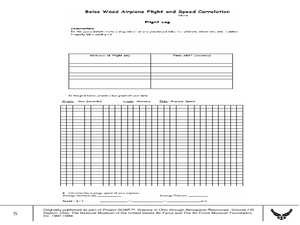
Ninth graders calculate the average speed of their balsa wood airplane. For this physics lesson, 9th graders build their own airplane and make necessary modifications to to make it fly straight. They interpret distance and time graph...
Curated OER
Marine Protected Areas
Students design a research project about a Marine Protected Area they chose. In this marine biology instructional activity, students gather fish count and catch data then graph them. They create an information poster about their findings.
Curated OER
Eratosthenes And Radius of the Earth
Learners calculate the radius of the earth. They use the method and data suggested by Eratosthenes. They investigate the interrelationships among mass, distance, force, and time through experimental processes.
Curated OER
Rate of Solution
Eighth graders determine the amount of agitation necessary to dissolve various sized sugar particles. This task assess students' abilities to collect, organize, and interpret data, create appropriate graphs, predict future events based...
Curated OER
Predator/Prey Relationship
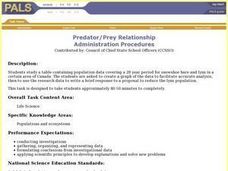
Students study and analyze data collected on the relationship between the snowshoe hare and lynx in Canada over a 28 year period and create a graph. Students also write a response to a proposal to reduce the lynx population.
Curated OER
Pumpkin Properties are a Smash!
Young scholars receive a miniature pumpkin and proceed through several stations to measure a variety of physical properties. The data is entered into a data sheet and the mass and volume measurements are used to calculate density. They...
Curated OER
Population Density
Students use the scientific method to conduct an experiment and use varied methods to gather background information. They correctly use lab equipment and prepare tables and graphs that organize, conclude, and present their findings. ...
Curated OER
Great Flathead Lake Ecosystem Mystery
Pupils analyze data to solve the mystery of what contributed to an ecological disaster at Great Flathead Lake. They read and graph the available data, create a food web of the problem ecosystem, and construct a formal problem statement...
Curated OER
Linear Functions-Learn Your Lines
Students solve and graph linear equations. In this algebra lesson plan, students collect and plot data on a coordinate plane. They use the CBL and TI calculator to graph systems of equation.
Curated OER
As a Matter of Fact
Elementary-aged scientists discover that all matter has mass. They are shown the difference between mass and weight, and learn how to calculate mass using the appropriate tools and methods. The scientific method is used while estimating...
Curated OER
Hlf-Ball
Young scholars investigate Newton's Laws of Motion and the Law of Conservation of Energy. They examine how a ball and half-ball behave and relate these laws to what happens to the ball. Students produce a graph of the data collected...
Curated OER
For The Birds
Seventh graders list the features of an ecosystem and identify local bird species. In this bird lesson students work in groups to formulate a hypothesis and test their theory by collecting and analyzing data.
Curated OER
Ice Melting
Students design investigations to test various materials to prevent heat gain in frozen water. The task assess students' knowledge of scientific inquiry including the following skills: observation, data collection, measurement,...
Curated OER
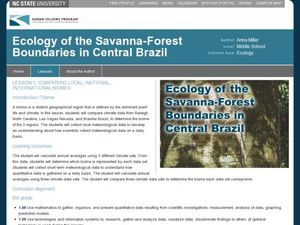
Comparing Local, National, International Biomes
Students calculate averages of climate sets of data. In this ecology activity, students analyze data to determine identity of a biome and collect meteorological data to understand process. Students also compare data sets.
Curated OER
Changes in Pulse Rate
Eighth graders practice making observations and collecting data after determining a baseline pulse rate then collect data on the changes in that rate with exercise. Students must organize their data and analyze their observations.
Polar Trec
Playground Profiling—Topographic Profile Mapping
The Kuril islands stretch from Japan to Russia, and the ongoing dispute about their jurisdiction prevents many scientific research studies. Scholars learn to create a topographic profile of a specific area around their schools. Then they...


