Curated OER
Which Holiday Parades Have You Seen?: Graph
First graders ask their classmates which holiday parades they have seen and record the responses to complete the graph. A basic lesson, but great for teaching or strengthening graphic skills.
CK-12 Foundation
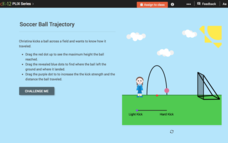
Quadratic Functions and Their Graphs: Soccer Ball Trajectory
Determine critical points in the flight of a soccer ball. Pupils use an interactive resource to find the vertex and x-intercepts of the graph of the trajectory of a soccer ball after being kicked. Scholars investigate the trajectory...
CK-12 Foundation
Graphs of Functions Based on Rules: Plotting Profits
Profit from this interactive on graphing and interpreting functions. An interactive allows learners to plot a square root function representing a company's profits. They answer some challenge questions that require interpreting this...
Special Olympics
Special Olympics Volleyball Coaching Guide: Teaching Volleyball Skills
From warm-up routines and stretches to skill progressions and passing drills, this is an absolute must-have resource for coaches teaching volleyball to a group of learners with diverse needs and skills.
Curated OER
Using Bar Graphs to Understand Voting Patterns
Bar graphs are used as a way to study voting patterns in the United States. A variety of statistical data is presented in the graphs, and pupils must interpret the data in order to make a report to the class. Three excellent graphs,...
Curated OER
Build a Bar Graph
Learners discover how to use bar graphs. They will gather and organize specific data in order to put it into a bar graph. Then they will answer several questions based on the information they have graphed.
Inside Mathematics
Graphs (2007)
Challenge the class to utilize their knowledge of linear and quadratic functions to determine the intersection of the parent quadratic graph and linear proportional graphs. Using the pattern for the solutions, individuals develop a...
Curated OER
When Will We Ever Use This? Predicting Using Graphs
Here are a set of graphing lessons that have a real-world business focus. Math skills include creating a scatter plot or line graph, fitting a line to a scatter plot, and making predictions. These lessons are aimed at an algebra 1 level...
Ohio Literacy Resource Center
Solving Systems of Linear Equations Graphing
Do you need to graph lines to see the point? A thorough lesson plan provides comprehensive instruction focused on solving systems of equations by graphing. Resources include guided practice worksheet, skill practice worksheet, and an...
Curated OER
Reading Graphs
Working independently or in teams, your class practices connecting graphs, formulas and words. This lesson includes a guided discussion about distance vs. time graphs and looking at how velocity changes over time.
Curated OER
Cutting Expenses
Students explore budgeting. In this finance and math lesson, students brainstorm ways in which households could save money. Students view websites that give cost reducing ideas. Students complete an expense comparison chart and use the...
Curated OER
Graphing Canada
Students research a province of Canada choosing a question to investigate. They record their information on a worksheet that is provided and complete a graph. They present their bar graphs to the class.
Curated OER
Reading Bar Charts
Help kids understand how to collect data through surveys, organize data in a bar chart, then analyze their findings. There are three different surveys for learners to conduct, a full description of all the parts of a bar chart, and three...
Curated OER
Graphing the Forecast - Line Graph or Bar Graph?
Sixth graders compare and contrast bar and line graphs. Using a weather forecast of the area, 6th graders record the high and low temperatures in a table. Students determine and justify the most appropriate graph to display a given set...
Kenan Fellows
Reading Airline Maintenance Graphs
Airline mechanics must be precise, or the consequences could be deadly. Their target ranges alter with changes in temperature and pressure. When preparing an airplane for flight, you must read a maintenance graph. The second...
Curated OER
Bar Graphs and Pictographs
How are bar graphs and pictographs different? As you begin this concept, use these simple graphs to help get learners started with data analysis styles. There is one bar graph and one pictograph, each accompanied by four or five...
Inside Mathematics
Graphs (2006)
When told to describe a line, do your pupils list its color, length, and which side is high or low? Use a worksheet that engages scholars to properly label line graphs. It then requests two applied reasoning answers.
Curated OER
Reading Bar Graphs #2
Raise the bar in your third grade class with this learning exercise on bar graphs. Youngsters view three graphs representing three different sets of data, and answer questions based on what they analyze. The first set is completed as an...
Math Worksheets Land
Pie or Circle Graphs Problems - Independent Practice Worksheet
Third graders take a set of data and turn it into a pie graph with an independent worksheet. Containing 10 sets of data, the resource reinforced data analysis skills that pupils can use throughout a graphing unit.
Curated OER
Going Graph-y
Second graders listen to and dicuss the story Where the Wild Things Are. They play a pantomime game and act out various feelings so their classmates can guess. They listen for the frequency of certain words, and record their findings on...
Curated OER
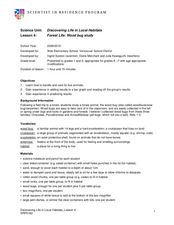
Forest Life- Wood Bug Study
Examine wood bugs and their habitat. Learners gather wood bugs and examine their bodies. Then discuss their body parts and how they help them survive. They also predict where they think wood bugs live to then graph the class results.
Curated OER
Piecewise Linear Functions: Extending Stories to Graphs
Using this resource, scholars develop graphs that model situations by showing change over time. They answer 15 questions based on information from charts that show growth in weight. They extend the concepts to an assessment section of...
Curated OER
Reading Bar Graphs
Working on bar graphs in your math class? Use a thorough worksheet to reinforce graphing and problem solving skills with your third graders. After reviewing two bar graphs, young learners answer ten questions about the data represented...
Math Worksheets Land
Pie or Circle Graphs - Guided Lesson
A guided lesson worksheet reinforces pie graph skills using a given set of data. Each problem requires young mathematicians to create a circle graph using five colors, and to provide a key that goes along with the graph.
Other popular searches
- Graphing Skills Lesson Plans
- Basic Graphing Skills
- Organizing and Graphing Data
- Introducing Graphing Skills
- Graphing Skills Using M&ms
- Graphing Skills in Science
- Graphing Skills for Prek
- Graphing Skills With Fruits
- Graphing Skills in Chemistry
- Graphing Skills for Perk
- Graphing Skills Worksheet
- Reading Graphing Skills


