Curated OER
Graphing Ordered Pairs
Are you working on graphing ordered pairs in your class? In this worksheet, learners, after looking over and studying how to graph ordered pairs, plot points on a coordinate grid and connect the dots. Class members also identify what...
Curated OER
Easter Graphing Fun
Graphing can be festive! This Easter worksheet has scholars using coordinates to record the location of ten holiday images. The first is done for them, and the grid is large and appealing to younger learners. Consider visualizing this...
Curated OER
Picture Graphs
An innovative way to practice reading data, as well as the four operations! Three picture graphs prompt first graders to count marbles, books, and pets. They also solve addition and subtraction problems. Additionally, they work on...
CPO Science
Physics Skill and Practice Worksheets
Stop wasting energy searching for physics resources, this comprehensive collection of worksheets has you covered. Starting with introductions to the scientific method, dimensional analysis, and graphing data, these skills practice...
US Department of Commerce
Looking at Numbers of Births Using a Line Graph
Was there a baby boom? Using census data, class members take a look at the number of 8-11 year olds and determine their birth years. Scholars create a double line graph to compare the number of births for two states for several years....
Curated OER
Bar Graphs and Line Graphs
In this bar graphs and line graphs learning exercise, students examine given data, organize it, and create bar graphs and line graphs from the given information. They interpret graphs and write statements explaining the graph. This one...
Flipped Math
Modeling with Graphs
Create a graph for anything in the world. Pupils continue to work with graphs that model situations. The learners analyze different graphs to answer questions about the scenario along with finding equations of graphs. Scholars use...
Florida Center for Reading Research
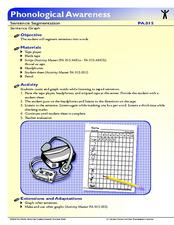
Phonological Awareness: Sentence Segmentation, Sentence Graph
Young scholars segment sentences while they listen to a series of sentences. Using a graph, pupils make a mark for each word they hear. Learners listen to each sentence three times; once to listen, once to mark, and once to check their...
Scholastic
Study Jams! Histograms
With so many ways to organize data, a histogram is useful when we need to graph a variety of ranges. The interactive lesson plan organizes heights into different categories, not too big and not too small, to display on a histogram. The...
CK-12 Foundation
Bar Graphs, Frequency Tables, and Histograms: Comparing Heights
Become a master at creating visual displays. Using a provided list of heights, users of the interactive create a bar graph and a histogram. They answer a set of challenge questions based on these data representations.
National Security Agency
Going Green with Graphs
In this unit designed for second graders, youngsters are introduced to conducting surveys and creating tally charts based on the data they gather. Students then construct bar graphs, and observe the relationships between the two types of...
EngageNY
Every Line is a Graph of a Linear Equation
Challenge the class to determine the equation of a line. The 21st part in a 33-part series begins with a proof that every line is a graph of a linear equation. Pupils use that information to find the slope-intercept form of the equation...
Curated OER
Drive the Data Derby
Three days of race car design and driving through the classroom while guessing probability could be a third graders dream. Learn to record car speed, distances traveled, and statistics by using calculation ranges using the mean, median,...
Virginia Department of Education
Graphs
Examine different types of graphs as a means for analyzing data. Math scholars identify the type of graph from a series of data displays and then develop questions to match each one. Then, given a scatter plot of height versus age data,...
EngageNY
Graphs of Exponential Functions and Logarithmic Functions
Graphing by hand does have its advantages. The 19th installment of a 35-part module prompts pupils to use skills from previous lessons to graph exponential and logarithmic functions. They reflect each function type over a diagonal line...
Inside Mathematics
Vencent's Graphs
I like algebra, but graphing is where I draw the line! Worksheet includes three multiple-part questions on interpreting and drawing line graphs. It focuses on the abstract where neither axis has numbers written in, though both are...
West Contra Costa Unified School District
Graphing Piecewise Functions
Step up to learn about step functions. The lesson, designed for high schoolers, first covers piecewise functions and how to draw their graphs. It then introduces step functions, including the greatest integer (floor) and ceiling functions.
Kenan Fellows
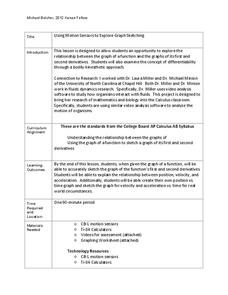
Using Motion Sensors to Explore Graph Sketching
Get moving to a better understanding of graphs of derivatives. Using motion sensors, scholars vary their velocities to create graphs of the first derivative of a function. The activity challenges groups to first create a script of the...
EngageNY
Graphs of Functions and Equations
Explore the graphs of functions and equations with a resource that teaches scholars how to graph functions as a set of input-output points. They learn how the graph of a function is the graph of its associated equation.
EngageNY
Interpreting, Integrating, and Sharing Information: Using Charts and Graphs about DDT
Is American growing fatter? Scholars begin with a mini lesson on reading charts and graphs using information about Human Body Fat in United States. They then transfer what they learned to charts and graphs using harmful and beneficial...
Willow Tree
Line Graphs
Some data just doesn't follow a straight path. Learners use line graphs to represent data that changes over time. They use the graphs to analyze the data and make conclusions.
West Contra Costa Unified School District
Exploring Quadratics and Graphs
Young mathematicians first graph a series of quadratic equations, and then investigate how various parts of the equation change the graph of the function in a predictable way.
EngageNY
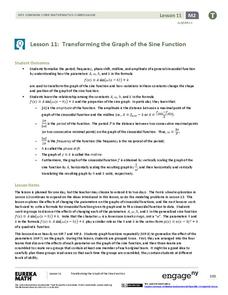
Transforming the Graph of the Sine Function
Build a solid understanding of trigonometric transformations through exploration. Learners work in teams to analyze the effects of different algebraic components on the graph of a sine function.
EngageNY
Analyzing Graphs—Water Usage During a Typical Day at School
Connect your pupils to the problem by presenting a situation with which they can identify. Individuals analyze a graph of water use at a school by reasoning and making conclusions about the day. The lesson emphasizes units and labels of...
Other popular searches
- Graphing Skills Lesson Plans
- Basic Graphing Skills
- Organizing and Graphing Data
- Introducing Graphing Skills
- Graphing Skills Using M&ms
- Graphing Skills in Science
- Graphing Skills for Prek
- Graphing Skills With Fruits
- Graphing Skills in Chemistry
- Graphing Skills for Perk
- Graphing Skills Worksheet
- Reading Graphing Skills


