Agile Mind
Transforming Graphs of Quadratic Functions
In the activity on this webpage, learners use interactive graphing technology to investigate transformations of graphs. In the first part of the task, they look at the graph of a quadratic function with coordinates of a few points...
Wordpress
Introduction to Exponential Functions
This lesson begins with a review of linear functions and segues nicely over its fifteen examples and problems into a deep study of exponential functions. Linear and exponential growth are compared in an investment task. Data tables are...
Curated OER
Location on a Grid
Locating a point on a grid is an important skill to master; use this practice sheet to give schlars some clear and useful experience. On a large, simple grid they use a coordinate system to find specific squares and color them a given...
University of Florida
A Walk in the Woods
Take class members on a field trip to the forest without leaving the classroom. Scholars learn content-related vocabulary and factors affecting forest health with class discussions and during a presentation. Scientists combine forestry...
Curated OER
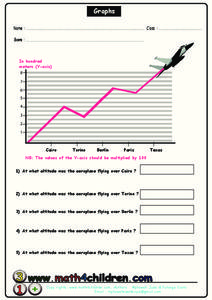
Graphs
In this graph practice worksheet, students examine a graph and use their problem solving skills on order to respond to 5 questions regarding the information presented on the graph.
Curated OER
Axis Graph Paper
For this literacy worksheet, students use the axis graph paper that is created using this worksheet. The sheet is a teacher's guide.
Curated OER
Graph Paper
In this literacy learning exercise, students are asked to complete the graphing activities using the newly created worksheets. The sheet itself is a guide for teachers to create graph paper styles.
Curated OER
Asymmetric Graph Paper
For this literacy worksheet, students use the created asymmetrical graph paper for class activities. The sheet is intended to be a teacher's guide.
Curated OER
Organizing Data
In this statistics worksheet, 11th graders collect data and organize it using a frequency table. They plot their data and analyze it using stem and leaf plots. There are 3 questions with an answer key.
Curated OER
Tables and Graphs Practice
In this table and graph worksheet, learners are given three scenarios with data. They construct a table and a graph for each scenario.
Curated OER
Contour and Cross-Section Skills
In this geography worksheet, learners identify the Wolf Creek Crater and how it was formed. They examine a contour map given of how the crater would look from above. Then, pupils use a ruler to draw lines as on the graph to the side....
Noyce Foundation
Granny’s Balloon Trip
Take flight with a fun activity focused on graphing data on a coordinate plane. As learners study the data for Granny's hot-air balloon trip, including the time of day and the distance of the balloon from the ground, they practice...
Virginia Department of Education
May I Have Fries with That?
Not all pie graphs are about pies. The class conducts a survey on favorite fast food categories in a lesson on data representation. Pupils use the results to create a circle graph.
Inside Mathematics
Sorting Functions
Graph A goes with equation C, but table B. The short assessment task requires class members to match graphs with their corresponding tables, equations, and verbalized rules. Pupils then provide explanations on the process they used to...
Virginia Department of Education
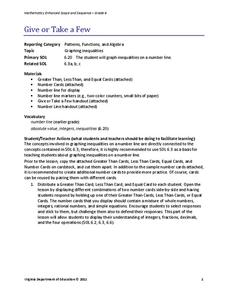
Give or Take a Few
Young mathematicians extend their knowledge of rational numbers on a number line to graph inequalities by first using number cards to compare rational numbers. They finish by using similar reasoning to graph inequalities on a number line.
Curated OER
Evolution Study Guide
Thirty short-answer questions comprise this detailed review of evolution theory. Many of the questions ask scholars to define vocabulary. Because short answers are required, this activity will take some time to complete. You could give...
Inside Mathematics
Squares and Circles
It's all about lines when going around. Pupils graph the relationship between the length of a side of a square and its perimeter. Class members explain the origin in context of the side length and perimeter. They compare the graph to the...
Illustrative Mathematics
Identifying Quadratic Functions
Put your high schoolers to the test and see how well they know their quadratic functions. With excellent thought-provoking questions, learners use what they know about creating quadratic equations based off different pieces of...
Illustrative Mathematics
Building a Quadratic Function Form
A simple tweak in the equation can mean big things for a quadratic graph. High school mathematicians look at the parent graph of a quadratic and incorporate three different changes to the function. The problems require explanations of...
EngageNY
Geometric Interpretations of the Solutions of a Linear System
An intersection is more than just the point where lines intersect; explain this and the meaning of the intersection to your class. The 26th segment in a 33-part series uses graphing to solve systems of equations. Pupils graph linear...
EngageNY
Linear Equations in Two Variables
Create tables of solutions of linear equations. A lesson has pupils determine solutions for two-variable equations using tables. The class members graph the points on a coordinate graph.
West Contra Costa Unified School District
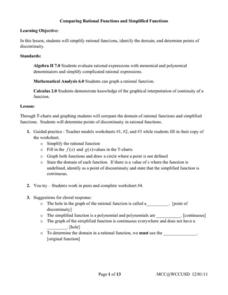
Comparing Rational Functions and Simplified Functions
What kind of functions have holes in their graphs? Here, the teacher guides the class on how to use the simplified function of a rational function to aid in the graphing of the original rational function. T-tables are used in order to...
EngageNY
There is Only One Line Passing Through a Given Point with a Given Slope
Prove that an equation in slope-intercept form names only one line. At the beginning, the teacher leads the class through a proof that there is only one line passing through a given point with a given slope using contradiction. The 19th...
Teach Engineering
Forms of Linear Equations
Linear equations are all about form. The fifth part in a unit of nine works with the different equivalent forms of linear equations. Class members become familiar with each form by identifying key aspects, graphing, and converting from...
Other popular searches
- Graphing Skills Lesson Plans
- Basic Graphing Skills
- Organizing and Graphing Data
- Introducing Graphing Skills
- Graphing Skills Using M&ms
- Graphing Skills in Science
- Graphing Skills for Prek
- Graphing Skills With Fruits
- Graphing Skills in Chemistry
- Graphing Skills for Perk
- Graphing Skills Worksheet
- Reading Graphing Skills


