NOAA
History's Thermometers
How is sea coral like a thermometer? Part three of a six-part series from NOAA describes how oceanographers can use coral growth to estimate water temperature over time. Life science pupils manipulate data to determine the age of corals...
NOAA
Tracking a Drifter
Be shore to use this drifter resource. The third installment of a five-part series has learners using the NOAA's Adopt-a-Drifter website to track to movement of a drifter (buoy) in the ocean. Graphing the collected data on a map allows...
S2tem Centers SC
Seasons
Winter, spring, summer, and fall—take the learning of the seasons beyond the elementary level to the middle school classroom. Curious learners begin by watching videos about the seasons and the rotation of planet Earth. Then, they...
Messenger Education
Mission: Possible—How Can We Plan an Exploration of Another World?
An astronaut's spacesuit weighs 280 pounds and takes 45 minutes to put on — that's a serious suit! The second activity of a three-part series allows pupils to see all that goes into space exploration. Through simulations, groups analyze...
Serendip
Changing Biological Communities – Disturbance and Succession
After cutting down a forest to make a farm, how long would it take the environment to turn an abandoned farm back into a forest? Scholars study this exact scenario while they interpret many charts and graphs of the changing ecosystems as...
Chicago Botanic Garden
Weather or Not
What is the difference between weather and climate? This is the focus question of a lesson that takes a deeper look at how weather data helps determine climate in a region. Using weather and climate cards, students decide if a statement...
Cornell University
Diffraction Demystified
Study diffraction patterns using CDs and DVDs! Scholars measure the diffraction patterns of a light wave as it hits a CD or DVD. Using the information, they can measure the distance between the tracks.
Serendip
Food, the Carbon Cycle and Global Warming
As the world population increases, demands on the carbon cycle also increase. A well-designed lesson plan first explores the greenhouse effect and its impact on global warming. Further sections have pupils study the effect of greenhouse...
Nuffield Foundation
Investigating Factors Affecting the Heart Rate of Daphnia
What variables change heart rate? Young scientists observe the beating heart in Daphnia to understand these variables. They make changes in temperature, chemicals, and other factors as they graph the heart rates. Analysis questions help...
Kenan Fellows
Solutions
Scientists require specific chemical solutions for their experiments. In the seventh and final installment in a series that integrates chemistry and algebra II, scholars learn to set up a system of equations to solve the volume of a...
Curated OER
Interpreting Data from Birdfeeders
What kinds of birds live in your area? Read a book about birds to your learners and explore their feeding patterns. Charts and graphs are provided in this three page packet, but consider assigning the basic questions if using with young...
Curated OER
Seaside Science
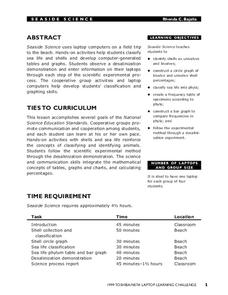
Students research sea life using laptop computers. In this sea life lesson plan, students participate in a field trip to the beach and enter observations into their laptop computers. Students classify shells and sea life.
Curated OER
Graphing the Standard Curve
Learners analyze colorimetric using a computer program. In this science lesson, students show application of standard curves by finding other areas of science where standard curve is analyzed.
Curated OER
Pendulum Lab in 9th Grade Physical Science
Ninth graders conduct experiments to determine what affects the rate of a pendulum's swing. Working in small groups, they identify an independent variable to study and create an experiment to test their hypothesis. When tests are...
Curated OER
Testing for Vitamin C in Different Drinks and Foods
Students examine the importance of vitamin c in their diets and the sources that it comes from. In this vitamin lesson students complete hands on activities, interpret data and make a bar graph.
Curated OER
Tables, Charts and Graphs
Students examine a science journal to develop an understanding of graphs in science. In this data analysis lesson, students read an article from the Natural Inquirer and discuss the meaning of the included graph. Students create a...
Curated OER
Solar Electricity ~ The Colour Sensitivity of a Photovoltaic Cell
Teacher's notes, a materials list, detailed procedure, tips, and extension ideas are all included to make teaching this lesson on photovoltaic cells a sunny spot in your day! After some brief background reading, physical science...
Curated OER
Get a Leg Up
Traveling through space is an amazing experience, but it definitely takes a toll on the body. After reading an article and watching a brief video, learners perform an experiment that simulates the effects of zero gravity on the human body.
National Research Center for Career and Technical Education
STEM: Lou-Vee Air Car
A comprehensive lesson plan on acceleration awaits your physicists and engineers! Two YouTube videos pique their interest, then sample F=ma problems are worked and graphed. The highlight of the lesson plan is the building of a Lou-Vee...
Curated OER
Graphing the Diversity of a Forest
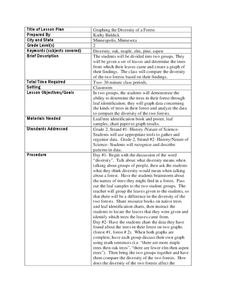
Second graders work in groups to identify what types of trees create which types of leaves In this plant life lesson plan, 2nd graders analyze a set of leaves and identify the tree it came from while graphing the data in a science...
Curated OER
"Graphing Your Motion"
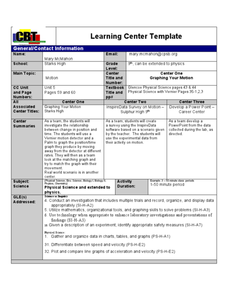
Students study the concepts of motion, velocity, and acceleration through graphing their own movement using LoggerPro. They explain the difference between speed and velocity using the weather vane example. They discover the difference...
Curated OER
Paper Airplane Science
Fifth graders recognize the need to follow the scientific method carefully and be aware of variables in experiments. In this airplane lesson plan, 5th graders design and test an airplane, and complete a data sheet. Students retest five...
Curated OER
Using GLOBE Data to Study the Earth System (College Level)
Students use the GLOBE Website to locate and study environmental data. They use the GLOBE Graphing Tool to display data. Students describe the role of solar energy in the annual fluctuations of soil moisture. They describe reservoirs and...
Texas Instruments
Data Collection for Bar Graphs
Learners study the concept of central tendency in this data collection for bar graph lesson. They collect data outside as instructed and organize it into a bar graphs, then they list in specific groups the labels that appear on the...


