Georgetown University
Cup-Activity: Writing Equations From Data
Determine how cup stacking relates to linear equations. Pupils stack cups and record the heights. Using the data collected, learners develop a linear equation that models the height. The scholars then interpret the slope and the...
CK-12 Foundation
Graphs in the Coordinate Plane: Functions on a Cartesian Plane
Connect the dots to graph a linear function. Young mathematicians use an interactive to first plot provided points on a coordinate plane. They connect these points with a line and then answer questions about the slope and y-intercept of...
Charleston School District
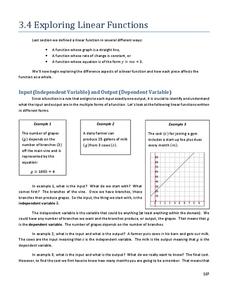
Exploring Linear Functions
What does a graph or equation say about a situation? Lots! The lesson uses the concepts explored in the previous four lessons in the series and applies them to problem solving situations. Learners create an equation from problems posed...
Curated OER
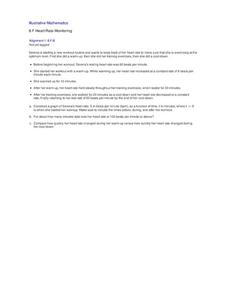
Heart Rate Monitoring
Algebra learners like this resource because it is easy to understand and it relates to their lives. Whether you are starting a new workout routine, or just climbing the stairs, your heart rate increases and decreases throughout the day....
Curated OER
Writing and Graphing Linear Equations on a Flat Surface
In this linear equations worksheet, students write the equation of a line with given characteristics. They identify the slope of a line and the y-intercept. Explanations and examples are provided at the beginning of the worksheet. This...
Curated OER
Getting Started with the TI-Navigator™ System: What's My Line?
Learners analyze linear functions in this algebra activity. They explore the meaning of slope and the slope-intercept form of a line as they investigate the effect changing parameters on the graph of a linear function.
Curated OER
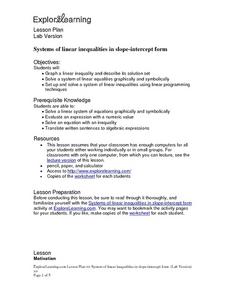
Systems of linear inequalities in slope-intercept form
Students graph a linear inequality and describe its solution set. They solve a system of linear equalities graphically and symbolically. Students set up and solve a system of linear inequalities using linear programming techniques. ...
Curated OER
Slope
Students calculate the slope of a line. In this slope lesson, students use a graph, an equation or two points to help them calculate the slope of a line. They differentiate between a slope of zero and an undefined slope.
Curated OER
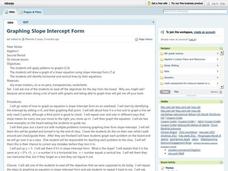
Graphing Lines
In this graphing lines worksheet, students graph lines that are in the point-slope form. They identify the y-intercept and the slope. They graph the equation of a line on a coordinate plane. This four-page worksheet contains 12...
Curated OER
Algebra I - Worksheet G12: Graphing Lines
In this graphing lines worksheet, high schoolers graph 28 lines given various data. Students graph lines given two points, a point and slope, and a line perpendicular or parallel to a point.
Curated OER
Reteaching graphing linear equations
Students graph linear equations. In this algebra lesson plan, students draw out comic strips to represent the steps when solving linear equations. They rewrite the equation in the slope intercept form and use the slope and intercept to...
Curated OER
Graph a Situation Without a Table
Students graph an equation without a table. In this algebra lesson, students are given rate or time and asked to graph a line at the starting rate. They use the slope intercept form to decipher the word problem and graph the line.
Charleston School District
Solving Systems Graphically
When guess and check gets old, it's time to start graphing! An instructive lesson explains how to solve a system of linear equations using graphing. Equations are in both slope-intercepts and standard form.
Radford University
Create A Ramp Design
Ramp up a design challenge. Class members design ramps to meet a client's requirements to comply with the American with Disabilities Act. The scholars create a scaled graph of their designs and determine the equations of the lines on...
West Contra Costa Unified School District
Standard Form of Conics
Looking for a complete go-to guide for the standard form of conics? This five-page packet does a nice job of connecting conics to prior knowledge of functions and transformations. Adapt the resource as Algebra II lesson plan notes, or...
Curated OER
Algebra: Linear Equations
Students draw graphs of linear equations using the slope intercept form. Upon completion of various problems, students record their answers on the board and explain the solutions to classmates. Students take a test over the material...
Curated OER
Straight Line Graphs
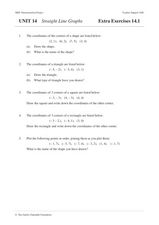
In this math worksheet, students plot lines on a graph paper when given the equation for the line in slope-intercept form. They tell the values of the slope and the y-intercept. Kids find the x and y intercepts and plot three lines....
Curated OER
Graphing Inequalities and Shading
Students graph and shade inequalities. In this algebra lesson, students graph inequalities using the slope-intercept form. They shade the side of the line that is the solution and identify the domain and range.
CK-12 Foundation
Input-Output Tables for Function Rules
How does changing a graph affect the function? Learners watch the changing input-output table as they adjust the location of the line graph. Questions prompt them to complete a table of values and determine the function rule.
Curated OER
Exploring Slope and Intercept
In this slope and intercept worksheet, students complete 23 problems involving sketching graphs, interpreting graphs, and interpreting slope.
Curated OER
The Slope of Parallel and Perpendicular Lines
In this Algebra I/Algebra II worksheet, students examine slope to determine if the given lines are parallel or perpendicular. Students determine the equation of lines that are either parallel or perpendicular to the given line. The two...
Curated OER
Practice Graphing y = mx + b
Ninth graders graph linear equations of the form y= mx + b. In this algebra instructional activity, 9th graders are able to graph a line given the slope and y-intercept. They can write the equations of a line given the graph of a line...
Curated OER
Graphing Linear Equations with Calculator
Students graph lines using the calculator. In this algebra lesson, students graph lines of equations in the form y=mx+b. They input equations into the TI Calculator and graph using the slope and intercept. They analyze the graph for...
Curated OER
Graphing Scatterplots
Students examine scatterplots and determine the equation of a line using the slope-intercept method. Students interpret graphs, draw inferences, and sketch a curve of best fit for the graph. Based upon patterns in the graphs, students...


