CK-12 Foundation
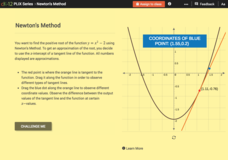
Newton's Method
Use an iterative process to find an approximation of a square root. Pupils use the interactive to find an approximation to find the positive root of a quadratic function with Newton's method. With the graphs, learners position the...
Flipped Math
Sketching Polynomial Functions
Provide a sketch of the suspect. Scholars see how to use the key aspects they know about polynomials to create a sketch of the graph. Learners factor to calculate the zeros by factoring, find the end behavior, and determine the...
Mathed Up!
Coordinates
Young graphers decide where to plot a point given a specific ordered pair. The problems vary in difficulty, beginning with simpler coordinates, and ending with plotting and connecting coordinates. Each graph is labeled with the...
Virginia Department of Education
Heat Transfer and Heat Capacity
It's time to increase the heat! Young chemists demonstrate heat transfer and heat capacity in an activity-packed lab, showing the transitions between solid, liquid, and gaseous phases of materials. Individuals plot data as the...
Teach Engineering
Quantum Dots and Colors
Introduce teams to quantum dot solutions with an activity that has them expose solutions to a blacklight, observe the colors, and take measurements. Groups graph the data and analyze the dependence between particle size and...
Virginia Department of Education
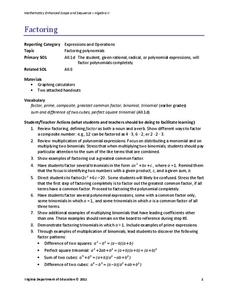
Factoring
Uncover the relationship between factoring quadratics and higher degree polynomials. Learners develop their factoring skills through repetition. A comprehensive activity begins with quadratics and shows how to use the same patterns to...
EngageNY
Understanding Box Plots
Scholars apply the concepts of box plots and dot plots to summarize and describe data distributions. They use the data displays to compare sets of data and determine numerical summaries.
101 Questions
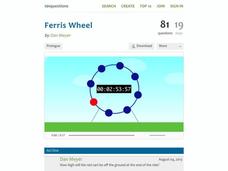
Ferris Wheel
Around and around you'll go! Learners analyze the periodic nature of a Ferris wheel. Using a trigonometric function, they make predictions about the location of a specific car at the end of the ride and its total trips around the circle.
Statistics Education Web
It’s Elemental! Sampling from the Periodic Table
How random is random? Demonstrate the different random sampling methods using a hands-on activity. Pupils use various sampling techniques to choose a random sample of elements from the periodic table. They use the different samples to...
Mathematics Vision Project
Circles: A Geometric Perspective
Circles are the foundation of many geometric concepts and extensions - a point that is thoroughly driven home in this extensive unit. Fundamental properties of circles are investigated (including sector area, angle measure, and...
Achieve
Yogurt Packaging
Food companies understand how to use math to their advantage. Learners explore the math related to the packaging and serving size of yogurt. They then use unit analysis and percent values to make decisions on the product development.
Statistics Education Web
Text Messaging is Time Consuming! What Gives?
The more you text, the less you study. Have classes test this hypothesis or another question related to text messages. Using real data, learners use technology to create a scatter plot and calculate a regression line. They create a dot...
EngageNY
Making Fair Decisions
Life's not fair, but decisions can be. The 17th installment of a 21-part module teaches learners about fair decisions. They use simulations to develop strategies to make fair decisions.
Chicago Botanic Garden
Weather or Not
What is the difference between weather and climate? This is the focus question of a activity that takes a deeper look at how weather data helps determine climate in a region. Using weather and climate cards, students decide...
Kenan Fellows
Introduction to a Flight Computer
Keep your hands on the wheel—at all times! Scholars learn why pilots use a flight computer through a high-flying demonstration. Making calculations for speed, distance, or time is automatic if you know how to use a flight computer.
Virginia Department of Education
Radioactive Decay and Half-Life
Explain the importance of radioactive half-life as your high school biologists demonstrate the concept by performing a series of steps designed to simulate radioactive decay. Pupils use pennies to perform an experiment and gather data....
Federal Reserve Bank
Making Sense of the Ups and Downs of Prices
What are the consequences and costs of inflation? What is CPI, and how do we calculate it? This resource answers these questions in an organized and in-depth manner, and also includes a worksheet of follow-up questions designed for...
EngageNY
The Most Important Property of Logarithms
Won't the other properties be sad to learn that they're not the most important? The 11th installment of a 35-part module is essentially a continuation of the previous lesson, using logarithm tables to develop properties. Scholars...
EngageNY
Vectors in the Coordinate Plane
Examine the meaning and purpose of vectors. Use the lesson to teach your classes how find the magnitude of a vector and what it represents graphically. Your pupils will also combine vectors to find a resultant vector and interpret its...
EngageNY
Finding One Hundred Percent Given Another Percent
Class members solve problems to find the whole when given a percent. They use double line numbers and factors of hundred to help break the 100 percent into equal segments.
02 x 02 Worksheets
Slope
What does slope have to do with lines? Pupils work with lines and determine the slope of the lines informally and with the slope formula. Groups use their knowledge to calculate the slopes of parallel and perpendicular lines. They also...
PBL Pathways
Boogie Boards
Solve a complex business puzzle by building a linear programming model. An engaging project-based learning problem has classes examining transportation costs and manufacturing limitations from several plants. Ultimately, they use their...
PBL Pathways
What Should Have Happened on Gilligan's Island?
"Just sit right back and you'll hear a tale ..." Gilligan's Island is a classic that spans generations and offers a problem-solving opportunity for scholars. Take a project-based learning approach to examine the population of the island....
The New York Times
Understanding the Mathematics of the Fiscal Cliff
What exactly is the fiscal cliff? What are the effects of changing income tax rates and payroll tax rates? Your learners will begin by reading news articles and examining graphs illustrating the "Bush tax cuts" of 2001 and 2003. They...


