Curated OER
Bar Graph- Calories In Fast Food Items
In this bar graph worksheet, learners analyze a bar graph that shows calories in 10 fast food menu items. Students answer 7 questions about the graph.
Curated OER
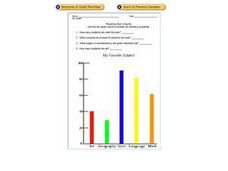
Reading Bar Graphs: My Favorite Subject
In this bar graphs worksheet, learners analyze a bar graph about favorite school subjects. Students use the information on the graph to answer 7 questions.
Curated OER
Circle Graph: Snoozing Animals
In this circle graphs worksheet, students make a circle graph for each animal shown in a chart showing average number of hours each animal sleeps and is awake.
Curated OER
Number lines and graphs
In this number lines and graphs worksheet, learners identify points on a number line and in a graph. Students complete 10 multiple choice questions.
Curated OER
Analyzing Non-Fiction Text Features- Graphs
Students examine the text features of non-fiction. For this literacy lesson, students practice reading graphs and discover the authors intent for using them in primary and secondary sources.
Curated OER
Graphing Linear Equations
Students graph linear equations. In this algebra lesson, students perform transformation on linear equations. They identify the slope and y-intercept of each line.
Curated OER
Easter Bar Graph - (B)
In this math review worksheet, students complete addition, subtraction, multiplication, and division problems and put their answers into a bar graph that represents calories. Students complete 13 problems and 1 graph.
Curated OER
Making Graphs
Students explore statistics by conducting class demographic surveys. In this graph making activity, students identify the family members of each classmate, pets they own, and favorite activities. Students organize their statistics and...
Curated OER
Problem Solving: Use a Graph 3
In this math problem solving worksheet, students examine a graph based on books read and use it to solve 2 problem solving questions and a test prep question.
Curated OER
Use a Bar Graph
In this bar graph worksheet, students use data from a bar graph to solve an addition sentence. To help students solve the problem they use the problem solving strategies of understand, plan, solve, and look back.
Curated OER
Read a Bar Graph
In this bar graph worksheet, students use a bar graph of favorite zoo animals to solve 6 simple word problems. Houghton Mifflin text is referenced.
Curated OER
Double Bar Graphs
In this double bar graphs practice worksheet, students sharpen their problem solving skills as they solve 6 story problems.
Curated OER
Making A Horizontal Bar Graph
In this bar graph instructional activity, students create a bar graph to display 6 scores from basketball games. Students will label the x and y axis and correctly plot the scores from the table provided.
Curated OER
Halloween Graph Paper
In this Halloween graphing worksheet, 5th graders enhance their math skills by using the graph to help them collect and organize data.
Curated OER
Halloween Graph Paper
In this Halloween-themed math worksheet, students use graph paper for math activities. Students may use this to align numbers correctly or to create graphs.
Curated OER
Graphing Review
in this graphing review instructional activity, students solve a variety of problems such as interpreting parabolas, identifying intercepts and asymptotes, and identifying functions. They solve piecewise functions and rational functions....
Curated OER
Graphing Data
First graders explore the concept of graphing. In this data lesson, 1st graders gather information from a class survey and display their findings on a picture graph. Students also practice solving problems that their instructor models.
Curated OER
Reading Graphs
For this reading graphs practice worksheet, students examine a graph and respond to 5 questions that require them to record the coordinates of 5 shapes on the gridded graph.
Curated OER
My Test Book: Reading Graphs
For this online interactive math skills worksheet, students solve 10 multiple choice math problems that require them to read and interpret graphs. Students may view the correct answers.
Curated OER
Graphing Linear, Circular, and Parabolic Inequalities
For this graphing worksheet, students are given nine inequalities and then must graph five of their intersections. A grid and cartoon hint are provided.
Curated OER
Graphing Linear Equations
Eighth graders examine linear equations by creating graphs from them. In this graphing lesson, 8th graders read several linear equations and plot them on a graph with the help of their classmates. Students find the slope of the linear...
Curated OER
Analyzing Nonfiction Text Features - Graphs
Students examine the text features of non-fiction. In this literacy lesson plan, students practice reading graphs and discover the authors intent for using them in primary and secondary sources.
Curated OER
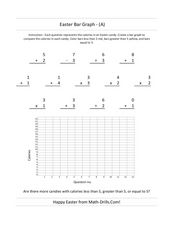
Easter Bar Graph- A
In this Easter math activity, students first solve 13 problems with addition, subtraction, multiplication and division. Using the answers, students make a bar graph.
Curated OER
Easter Bar Graph - C
In this math review learning exercise, students complete addition, multiplication, division, and subtraction problems where each answer is inserted into a bar graph. Students complete 13 problems.
Other popular searches
- Charts and Graphs
- Bar Graphs
- Line Graphs
- Double Bar Graph
- Circle Graphs
- Pie Charts and Graphs
- Picture Graphs
- Coordinate Graphs
- Skittles Bar Graph
- Reading Charts and Graphs
- Blank Coordinate Graphs
- Percent Circle Graph


