PBL Pathways
Students and Teachers 2
Examine trends in student-to-teacher ratios over time. Building from the first task in the two-part series, classes now explore the pattern of student-to-teacher ratios using a non-linear function. After trying to connect the pattern to...
Curated OER
When Will We Ever Use This? Predicting Using Graphs
Here are a set of graphing lessons that have a real-world business focus. Math skills include creating a scatter plot or line graph, fitting a line to a scatter plot, and making predictions. These lessons are aimed at an algebra 1 level...
Shodor Education Foundation
Regression
How good is the fit? Using an interactive, classmates create a scatter plot of bivariate data and fit their own lines of best fit. The applet allows pupils to display the regression line along with the correlation coefficient. As a final...
NASA
Developing an Investigation
Watch as your class makes the transition from pupils to researchers! A well-designed lesson has scholars pick a solar wind characteristic to research. They then collect and analyze official data from the LANL website. This is the third...
Curated OER
A Picture is Worth a Thousand Words: Introduction to Graphing
Students practice graphing activities. In this graphing lesson, students discuss ways to collect data and complete survey activities. Students visit a table and graphs website and then a create a graph website to practice graphing.
Curated OER
Graphing with Stems-and -Leafs
Fourth graders examine the use of stem and leaf graphs. For this stem and leaf graph lesson, 4th graders participate in teacher led lesson showing the use of the graphs. They work in groups to collect data about peanuts before making a...
Curated OER
Data Collection and Graphing
Students collect data and graph it on a coordinate plane and analyze it. In this statistics lesson, students display their data collection using a graph. They determine which central tendency will work best.
Curated OER
Making A Horizontal Bar Graph
In this bar graph instructional activity, students create a bar graph to display 6 scores from basketball games. Students will label the x and y axis and correctly plot the scores from the table provided.
Curated OER
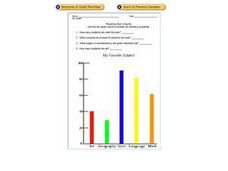
Reading Bar Graphs: My Favorite Subject
In this bar graphs worksheet, learners analyze a bar graph about favorite school subjects. Students use the information on the graph to answer 7 questions.
Curated OER
Graphing
Fifth graders practice using math graphs. In this graphing instructional activity, 5th graders work in groups to develop a topic of their own to represent as a graph. Students collect data and construct a graph for the instructional...
Curated OER
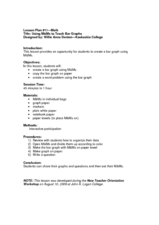
Using M&M's to Teach Bar Graphs
Motivate your class with this lesson. While not fully fleshed out, this activity is meant to be used as an introduction to the use of bar graphs. Learners sort M&M's and create bar graphs to display their information.
Curated OER
Introduction to Graphs
Students poll classmates to gather information for a graph. They identify three types of graphs (bar, line, table). Students create each type of graph using data gathered from classmates.
Curated OER
M & M Madness
M&M's are always a great manipulative to use when teaching math. In this graphing lesson plan, learners predict how many of each color of M & M's there are. They count up each color and plug the data into a graph using the...
Illustrative Mathematics
Puzzle Times
Give your mathematicians this set of data and have them create a dot plot, then find mean and median. They are asked to question the values of the mean and median and decide why they are not equal. Have learners write their answers or...
US Department of Commerce
Immigration Nation
People come and people go. Given tabular census data on the annual number of immigrants from four different regions of the world between 2000 and 2010, pupils create double bar graphs and line graphs from the data. They analyze their...
Statistics Education Web
The United States of Obesity
Mississippi has both the highest obesity and poverty rate in the US. Does the rest of the data show a correlation between the poverty and obesity rate in a state? Learners tackle this question as they practice their skills of regression....
Scholastic
Study Jams! Histograms
With so many ways to organize data, a histogram is useful when we need to graph a variety of ranges. The interactive lesson plan organizes heights into different categories, not too big and not too small, to display on a histogram. The...
Radford University
How Is Your Gender Represented?
Does the media shape people's views on gender? Scholars use data on gender portrayal in magazines to explore the idea. They use a spreadsheet program to create bar graphs and perform a chi-square test. They also use provided data to...
Illustrative Mathematics
Telling a Story With Graphs
Turn your algebra learners into meteorologists. High schoolers are given three graphs that contain information about the weather in Santa Rosa, California during the month of February, 2012. Graph one shows temperatures, graph two...
Curated OER
Weather Data Analysis
In this weather worksheet, students read a data table comparing the temperature and weather conditions at three different locations. Students use this data to complete 8 fill in the blank, 1 short answer question, and one graph.
Curated OER
Make Your Own
Your first and second graders will categorize hearts, triangles, and stars, putting them in a picture graph. After the shapes are organized, they compare the number of each using the sentence frames provided.
Curated OER
Creating Graphs from Tables
Students interpret data from tables and then create a graph to show the same data in a different organization.
Curated OER
Range and Mode Reteach 4.5
In this range and mode worksheet, students analyze the data table and graph that show numbers of books read. Students use the data to answer 4 questions.
Curated OER
Watch the Birdie
In this data table worksheet, students solve 6 word problems in which information about birds on a data table is used to answer each question.


