Curated OER
Where Do I Fit on the Graph?
Young scholars collect data and create graphs about themselves, their community, and the world around them. They use a variety of methods to organize data, such as stickers, clothespins, name tags, coloring, tally marks, etc.
Curated OER
What Did It Cost 100 Years Ago?
Students compare prices of good across the century in order to introduce the topic of inflation. They undertand the concepts of inflation and Consumer Price Index (CPI), use online calculators to figure the approximate cost of goods...
Curated OER
Math Regents Exam Questions - Pearson Integrated Algebra P.304: Histograms
In this histograms worksheet, students solve 9 short answer, multiple choice, and graphing problems. Students construct frequency tables and histograms of data.
Curated OER
Excel temperature Graphs
Students gather data about the weather in Nome, Alaska. In this Nome Temperature lesson plan, students create an excel graph to explore the weather trends in Nome. Students will find the average weather and add a trend line to...
Curated OER
Snack Attack
Students design charts, tables, graphs, and pictographs to analyse the types of snacks in a bag.
Curated OER
Weather
Learners create a spreadsheet and chart using data collected. In this weather lesson, students select five cities from their state, including the city they live in. Learners take daily temperature readings from all five...
Curated OER
Comparing Costs
Students compare the costs of two cellular phone plans and determine the best rate. They use a table and a graph of points plotted on a Cartesian plane to display their findings. Students write an equation containing variables that could...
Curated OER
If Our Class Went to See the Prince
First graders read the story One Monday Morning and create picture graphs based on the number of teachers, boys, and girls that would visit the prince. In this data lesson plan, 1st graders interpret tables and graphs with the help of...
Curated OER
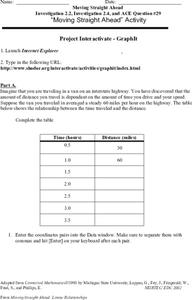
Moving Straight Ahead
In this functions learning exercise, 9th graders solve and complete 24 various types of problems. First, they complete the table with the correct distance for each hour given. Then, students enter the coordinate pairs into the function...
Curated OER
Animal Runners
In this collecting data worksheet, 4th graders use the data shown on how fast 6 animals can run to create a bar graph. Students follow the instructions on 3 directives for their bar graphs and answer 1 short answer question.
Curated OER
Forces and Graphing
Students analyze graphs to determine relationships between variables and rates of change. They determine the basic concepts about static reaction forces. They determine the slope and equation of a line.
Curated OER
Favorite Days
Young scholars collect and organize data about themselves. In this data analysis lesson, students discuss their favorite calendar dates and explore ways to display the data.
Curated OER
Lesson 6-7: Scatter Plots and Equations of Lines
In this scatter plot worksheet, students examine tables and write a linear equation that matches the table. Students graph linear equations. They read scatter plots, determine the trend line, and write a linear equation to...
Curated OER
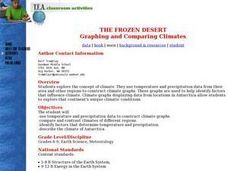
The Frozen Desert: Graphing and Comparing Climates
Students explore the concept of climate. They use temperature and precipitation data from their area and other regions to construct climate graphs. These graphs are used to help identify factors that influence climate.
Curated OER
Leveled Problem Solving: Histograms
In this using data, frequency table, and histogram to solve word problems worksheet, learners solve problems about prices of toys and numbers of toys sold to solve consumer mathematics problems. Students solve six problems.
Curated OER
Mean, Median, and Mode
Fourth graders compare two sets of data by using a double bar graph. In this data analysis activity, 4th graders study a double bar graph and complete questions based upon the data. Students construct a table to show the data from the...
Curated OER
Analyze This
Students gain practice in the analysis of various types of graphs common in daily life. These examples often use graphic images like charts, graphs, tables, and pictures to supplement learning.
Curated OER
Reading the Neighborhood
First graders complete activities with the story One Monday Morning in the Macmillan/McGraw Hill Textbook. In this data lesson, 1st graders read the story and gather data to create a picture graph. They read the graph and answer...
Curated OER
When Dinosaurs Ruled the World
Students graph the varying sizes of dinosaurs. In this math and dinosaur lesson, students view dinosaur models and compare the different shapes and sizes of the dinosaurs. Students complete a dinosaur math activity, read The...
Curated OER
Analyze and Interpret Statistical Information
In this probability and statistics worksheet, 9th graders analyze and interpret histograms as they identify trends in the data. The two page worksheet contains four problems. Answers are provided.
Curated OER
Wiggle Worms
First graders investigate worms, collect and analyze data. In this worm and data instructional activity, 1st graders listen to Chick and Duckling from the Macmillan/McGraw-Hill reading series. They conduct experiments with worms, collect...
Curated OER
Probability Using M&M's
Students estimate and then count the number of each color of M&M's in their bag. In this mathematics lesson, students find the experimental probability of selecting each color from the bag. Students create pictographs and bar graphs...
Curated OER
Histograms
In this histograms activity, students solve 5 word problems based on a histogram of presidential ages at their inauguration. Next, students create a frequency table and a histogram based on a list of data which shows the average snowfall...
Alabama Learning Exchange
Keep It Movin'!
Learners conduct an experiment to study friction. They complete a KWL chart on friction and conduct an activity about the amount of friction on a moving object. To conclude, pupils create a table or graph of the data collected and they...


