Curated OER
Get a Half Life!
Eighth graders use M&M's to experiment with data. They use a graphing calculator to determine the best equation for their data; linear, quadratic or exponential. They analyze the data to find the half-life of their M&M's.
Curated OER
Birthdays
Students collect data about the birth months of each classmate using a calendar. They make a table with the information before designing a pictograph using cupcake images. They answer questions using the graph.
Curated OER
Science and Technology
Students research inventions that have been created. In this historical technology lesson, students read the Harcourt Brace social studies textbook and discuss how inventors used graphs to display data. Students create a table to write...
Curated OER
Dangerous Fun
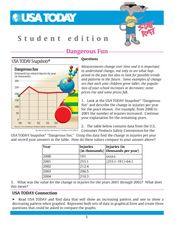
In this line graph worksheet, students analyze the data on a graph about toy-related injuries by year. Students solve 5 problems in which the change in injuries per year is calculated and recorded on a table.
Curated OER
Education for Global Peace
Fifth graders construct data graphs based upon sets of data. In this graphing instructional activity, 5th graders read the text If the World Were a Village and discuss how types of graphs accurately represent a large population. Students...
Curated OER
Investing
Students collect data on investments and draw conclusions. In this algebra lesson, students analyze exponential graphs as they relate to money. They discuss the cause of an account balance being high or low.
Curated OER
Tune...Um!
Students collect real data on sound. For this algebra lesson, students use a CBL and graphing calculator to observe the graph created by sound waves. They draw conclusion about the frequency of sound from the graph.
Curated OER
Radioactive Decay
Students generate a radioactive decay table for an imaginary element, use their data to plot a decay graph, develop the concept of half-life, and use the graph to "age" several samples.
Curated OER
Between The Extremes
Students analyze graphs for specific properties. In this algebra lesson, students solve equations and graph using the TI calculator. They find the different changes that occur in each graph,including maximum and minimum.
Curated OER
Cube Toss
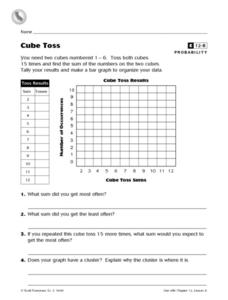
In this probability and graphing worksheet, students solve 8 problems in which data from a cube toss is displayed on a table and graph. Students answer the questions about their results.
Curated OER
Valentine's Day Math
First graders explore sorting and classifying. In this math lesson, 1st graders sort conversation hearts based on color. Students graph their results and enjoy the candy!
Curated OER
Ocean Botttom Profile
Students interpret a graph of ocean depths and topographic features. This task assesses students' abilities to interpret figures, organize and represent data, apply knowledge of scale to a profile, and apply theoretical knowledge.
Curated OER
Atlatl Lessons for Grade 4
Fourth graders explore the weapons of the Aboriginal people. In this fourth grade math lesson, 4th graders create charts, tables, or diagrams to represent patterns and relations. Students investigate which dart length has the best...
Curated OER
Round and Round and Round We Go!
Students investigate motion using a CBL. In this algebra instructional activity, students collect and graph data on a coordinate plane. They define and identify amplitude and period of conic graphs.
Curated OER
Finding a Line of Best Fit
Pupils engage in the practice of creating a scatter plot with the data obtained from measuring different resting heart rates. The data is used to create the table that is translated into a graph. The lesson gives instructions for the use...
Curated OER
Eye Color
Young scholars take a survey on eye color and plot their findings into a graph. In this eye color lesson plan, students take a class survey of everyone's eye color and learn how to put those findings into a graph.
Curated OER
Math Problem #1: Exhausting Fossil Fuel Resources
For this fossil fuel worksheet, students graph fossil fuel consumption from given information. Afterward, they estimate the annual rate of petroleum consumption and predict future consumption figures. In this one-page worksheet, there...
Curated OER
Charging Up, Charging Down: Exponential Models
Students collect and analyze voltage data. In this math lesson, students investigate exponential functions using the TI and a Voltage Probe. They graph their data and analyze it using a table.
Curated OER
Weather Conditions
For this weather conditions worksheet, students use a month of recorded weather conditions to create a graph comparing the number of days it was cloudy, raining, or clear. This worksheet has a graphic organizer and a graph.
Curated OER
Word Search Y3 Data
For this word search worksheet, students find the words in the word search and then circle them. There are 16 words in the word bank for students to locate. They then try to find any other words that they can. The answers are on the...
Curated OER
Modeling Linear Relationships
Young scholars graph lines using the slope and y-intercept. In this algebra lesson, students create data using tables and equations. They use their data to make predictions and draw conclusion.
Curated OER
Endangered Species
Ninth graders graph data in order to compare the number of extinct species and a rise in human population. They analyze the data collected. Students are encouraged to infer the relationship.
Curated OER
Sundials and Shadows - What Can They Teach Us About Seasons?
Pupils collect and analyze data relating to seasonal changes. They view a video, research web sites and build a sundial to collect their data.
Curated OER
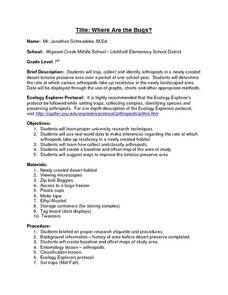
Where Are the Bugs?
Students trap, collect and identify arthropods in a newly created desert tortoise preserve area over a period of one school year. They determine the rate at which various arthropods take up residence in the newly landscaped area. Data is...


