Curated OER
Scatterplots
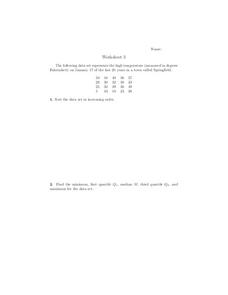
In this scatterplots worksheet, 9th graders solve and complete 6 different word problems with different sets of data. First, they sort the data set in increasing order and find the minimum, first quartile, median, third quartile, and...
National Council of Teachers of Mathematics
Eruptions: Old Faithful Geyser
How long do we have to wait? Given several days of times between eruptions of Old Faithful, learners create a graphical representation for two days. Groups combine their data to determine an appropriate wait time between eruptions.
Curated OER
What Color Are Your Eyes?
In this color of eyes worksheet, students conduct a survey to determine the number of students who have brown, hazel, blue or green eyes. The information is collected and then the data is organized. Students may use the data to create...
Curated OER
Quartiles, Percentiles, and Cumulative Frequency
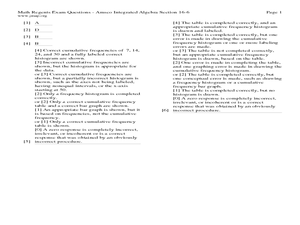
In this statistics lesson, 11th graders are asked to calculate the percentiles, quartiles and cumulative frequency given different graphs and data. There are 6 questions with an answer key.
Curated OER
Moving Straight Ahead
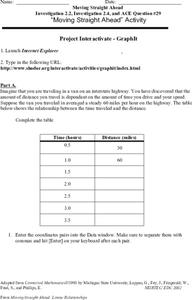
In this functions worksheet, 9th graders solve and complete 24 various types of problems. First, they complete the table with the correct distance for each hour given. Then, students enter the coordinate pairs into the function table...
Curated OER
Salt Front Data Set Activity
In this salt front worksheet, learners analyze data from the Hudson River and calculate highest and lowest River Mile locations as well as range of the salt front for each month on the data chart. After completing calculations, they...
Curated OER
Regents Exam
In this math worksheet, students perform basic operations all the way up to precalculus. They graph, identify slopes, plot data and analyze it. There are 34 questions.
Curated OER
Practice: Word Problems
Congratulations, you've just hit the word problem jackpot! Covering an incredible range of topics from integers and fractions, to percents, geometry, and much more, this collection of worksheets will keep young mathematicians busy...
Curated OER
Alkanes and Alkenes
In this alkanes worksheet, students use a data table to plot a graph of boiling point against number of carbon atoms. Students define cracking and double bond. This worksheet has 5 short answer questions.
Curated OER
Histograms and Frequency Tables
In this statistics worksheet, students solve and analyze graphs. They use histograms and frequency tables to solve their problems. There are 2 multiple choice questions with an answer key.
Georgia Department of Education
Math Class
Young analysts use real (provided) data from a class's test scores to practice using statistical tools. Not only do learners calculate measures of center and spread (including mean, median, deviation, and IQ range), but also use this...
Statistics Education Web
10,000 Steps?
Conduct an experiment to determine the accuracy of pedometers versus pedometer apps. Class members collect data from each device, analyze the data using a hypothesis test, and determine if there is a significant difference between the...
Statistics Education Web
Double Stuffed?
True or false — Double Stuf Oreos always contain twice as much cream as regular Oreos. Scholars first measure the masses of the filling in regular Oreos and Double Stuf Oreos to generate a class set of data. They use hypothesis testing...
Curated OER
Drops on a Penny
A helpful worksheet describes an interesting demonstration on the surface tension of water. Learners guess how many drops of water the heads side of a penny will hold. This resource does a great job of describing just how a penny can...
Curated OER
Get a Half-Life Student Worksheet
Young scientists use a worksheet to help them perform a lab on the decay of a radioactive element. The worksheet serves as both a task guide and a lab sheet for pairs of learners. This activity requires a calculator and has excellent...
Curated OER
Drops on a Penny
Young scientists explore the concept of surface tension at is applies to water. In this activity, learners use a dropper to place drops of water on a penny. Each group guesses how many drops a heads-up penny will hold, then conducts the...
Curated OER
Integrate Algebra Regents Exam Bimodal Questions Worksheet #1
In this Integrated Algebra worksheet, students solve problems that reflect the topics covered during the course of work. The answer key identifies each question by standard and topic. The twenty-four page worksheet contains two...
Math Aids
Math Aids: Graph Worksheets
Great resource to practice and strengthen math skills pertaining to graphs. Math worksheets are printable, may be customized, and include answer keys.


