CK-12 Foundation
Double Bar Graphs: Favorite Cookies Chart
It's just the way the cookie crumbles. Using the data from a class poll, learners create a double bar graph showing favorite cookie types. The pupils compare favorites between boys and girls with the aid of their graphs, then they make...
World Wildlife Fund
Bar Charts & Pie Charts
Learn about life in the Arctic while practicing how to graph and interpret data with this interdisciplinary lesson plan. Starting with a whole group data-gathering exercise, students are then given a worksheet on which they analyze and...
Math Worksheets Land
Pie or Circle Graphs - Guided Lesson
A guided lesson worksheet reinforces pie graph skills using a given set of data. Each problem requires young mathematicians to create a circle graph using five colors, and to provide a key that goes along with the graph.
Statistics Education Web
You Will Soon Analyze Categorical Data (Classifying Fortune Cookie Fortunes)
Would you rely on a fortune cookie for advice? The lesson first requires future statisticians to categorize 100 fortune cookie fortunes into four types: prophecy, advice, wisdom, and misc. The lesson goes on to have learners use...
Curated OER
Graphs of the OTHER Trig Functions
Students graph trigonometric functions. In this precalculus lesson, students identify the properties of secant ,cosecant and cotangent. They use the unit circle as their formula to graph and analyze these functions.
Curated OER
Who Took the Cookies
Students find the missing cookies. In this language arts lesson, students solve the mystery of who is taking the cookies from the cookie jar. Students are read several books with the same mystery of cookies being taken from the jar.
CK-12 Foundation
Systems of Linear Inequalities: Baking Cookies
Cook up a good resource for systems of linear inequalities. Using an interactive, individuals graph a system of linear inequalities to represent constraints on the number of cookies a person must bake. A set of challenge questions...
Curated OER
Domian and Range of Graphs
High schoolers determine the domain and range of various graphs using a graphing calculator. Given a set of graphs to analyze, learners calculate the range and domain of the graphs by plotting the graphs on their calculators. Downloads...
Curated OER
Make a Graph
In this graphing learning exercise, 1st graders use given data to create a graph and answer questions. In this problem solving learning exercise, students solve five problems.
Curated OER
Accounting/ Marketing Cookies
Second graders become involved in the advertisement, marketing, and development of their own cookie business. Students must choose a job for the preparation and baking of the cookies. Students also manage the profits and advertisement of...
Curated OER
Pictographs
What do these pictographs show? Scholars analyze three sets of data organized into pictographs, filling in several comprehension questions about each. The first one is done for them as an example, but consider going over it together to...
Texas Instruments
Data Collection for Bar Graphs
Learners study the concept of central tendency in this data collection for bar graph lesson. They collect data outside as instructed and organize it into a bar graphs, then they list in specific groups the labels that appear on the...
Curated OER
Concavity of a Graph
Learners explore the graph of a function. In this calculus lesson, students identify when and where the graph is increasing or decreasing. They identify if it concave up or down by moving the cursor.
Curated OER
Polar Graphs
Students graph polar graphs. In this calculus lesson, students convert between polar and rectangular coordinates. They graph their solution on the TI calculator and make observations.
Curated OER
Graphing Linear Equations
Students graph linear equations. In this algebra lesson, students perform transformation on linear equations. They identify the slope and y-intercept of each line.
Curated OER
Let's Graph It! Pre-Test
In this graphing worksheet, students complete a set of 10 multiple choice questions, clicking on a link to see correct answers or print the page.
Curated OER
Grasping Graphs
In this grasping graphs worksheet, students solve and complete 3 different types of problems. First, they graph the data described and select the appropriate graph type. Then, students identify the independent and dependent variable. In...
Curated OER
Math Review for Grade 2 (2.6)
For this math review for grade 2 (2.6) worksheet, 2nd graders answer 25 multiple choice questions in standardized test format about addition, subtraction and bar graphs.
Curated OER
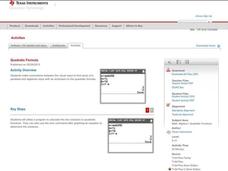
Quadratic Formula
This worksheet is part of the TI-Nspire lesson plan on the quadratic formula. Pupils determine the solutions of a quadratic function by looking at a graph and the discriminant. They use the quadratic formula to solve quadratic functions...
Curated OER
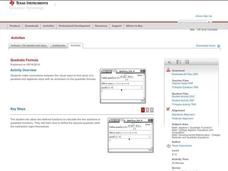
Quadratic Formula
Mathematicians determine the solutions of a quadratic function by looking at a graph. They use the quadratic formula to solve quadratic functions on their Ti-Nspire.
Curated OER
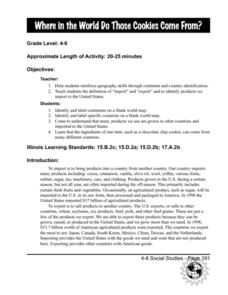
Where in the World Do Those Cookies Come From?
Students discuss exports and imports by discovering where the ingredients come from for making chocolate chip cookies. They take a survey of their favorite cookies and create a bar graph to represent the information.
Curated OER
Murder in the First Degree - The Death of Mr. Spud
Secondary learners investigate exponential functions in a real-world scenario. They collect data on the temperature of a cooling baked potato, enter the data into lists, and graph the data using a scatter plot before finding an...
Curated OER
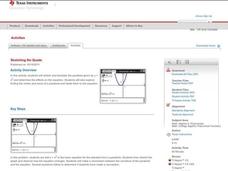
Stretching the Quads
Scholars investigate transforming parabolas. In this transforming parabolas lesson, they take the parent graph y=x^2 and transform it by shifting left, right, up, and down and shrinking and stretching. The class finds maximums,...
Curated OER
Curve Ball
Create a Height-Time plot of a bouncing ball using a graphing calculator. Graph height as a function of time and identify the vertex form of a quadratic equation that is generated to describe the ball's motion. Finally, answer questions...


