Texas Instruments
Function Notation - Texas Instruments
Using a TI-Nspire calculator, learners will work to better understand function notation and input/output functions. They write equations with a function symbols, identify what makes an equation a function, and graph lines in order to...
Curated OER
MAP Practice
In this geometry activity, students create circle, line and bar graphs using different comparisons of events. There are 24 questions with an answer key.
Curated OER
Proportionality in Tables, Graphs, and Equations
Students create different methods to analyze their data. In this algebra lesson, students differentiate between proportion and non-proportional graph. They use the TI-Navigator to create the graphs and move them around to make their...
Curated OER
Make a Circle Graph
In this making circle graphs practice worksheet, students sharpen their problem solving skills as they solve 6 story problems.
Curated OER
Exploring Complex Roots
In exploring the concept of complex roots, students find the axis of symmetry and roots of parabolas. Then, they discuss what makes a solution complex and how to identify functions with complex roots.
Curated OER
Writing Equations of Parabolas in Vertex Form
Pupils use their knowledge of the vertex form of a quadratic equation to graph parabolas using a graphing calculator, given a specific move to make. this lesson may be used as a review or as extra practice, in groups or individually.
Curated OER
Super Ticket Sales
Use this graphing data using box and whisker plots lesson to have learners make box and whisker plots about ticket sales of popular movies. They find the mean, median, and mode of the data. Pupils compare ticket sales of the opening...
Texas Instruments
Finding Linear Models Part III
Explore linear functions! In this Algebra I lesson, mathematicians graph data in a scatter plot and use a graphing calculator to find a linear regression and/or a median-median line. They use the model to make predictions.
Texas Instruments
Graphing Calculator Investigation Graphs of Relations
Learners investigate relations in this algebra lesson plan. They graph the set of ordered pairs that determine a relation. Using a TI-83 Plus, your learners will enter the coordinates in a list, create a scatter plot, and manipulate the...
Curated OER
Graphing the Absolute Vaule Function
Learners investigate the graph of the absolute value function and the relationship between the parameters of the equation and the graph of the function.
Curated OER
Common Sense Cookie Shop
First graders shop for a bag of cookies using toy money. In teams, they choose which variety to buy and decides which bills and coins are necessary to buy the bag of cookies and a cashier makes change. They tally the cookies purchased...
Curated OER
Graphing Rational Functions
Learners complete an activity, included, of the information on asymptotes and intercepts. They also solve and complete eight questions on graphing rational functions, file included. Finally, pupils summarize vertical asymptotes,...
Curated OER
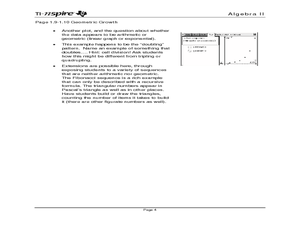
Sequence Graphs
Investigate arithmetic and geometric sequences by using a graphing calculator to determine if a sequence is linear or exponential.
Curated OER
Math TODAY for TI-Navigator System - Humidity Makes Air Feel Even Hotter ? Part II
Learners explore quadratic and cubic functions that will model the relationship between air temperature and heat index at fixed relative humidity values. They also make generalizations and apply the findings using their TI-83 Plus or...
Curated OER
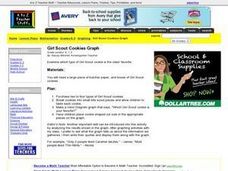
Girl Scout Cookies Graph
Students graph which girl scout cookies they like the best. They create a Venn Diagram about which one is their favorite. They place cookie shaped cutouts on the correct spot on the graph.
Curated OER
Graph It!
First graders use organized data to construct real object graphs, picture graphs, and bar-type graphs.
Curated OER
Systems of Equations
Texas Instruments and Glencoe/McGraw-Hill have put together a full lesson to help you instruct your math class. Using the textbook, a TI-83 calculator, and attached the PDF learners will solve systems of equations and state decimal...
Texas Instruments
Changing Functions
Your algebra 2 learners show what they can do in this assessment activity on shifting, reflecting, and stretching graphs. Given the graphs of various functions, they write the represented equation.
Penguin Books
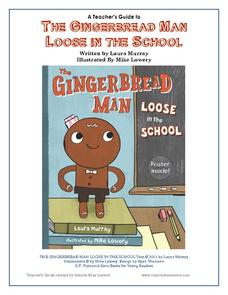
A Teacher's Guide to The Gingerbread Man Loose in the School
What if the Gingerbread Man was trying to catch you, rather than the other way around? Pupils can find out what happens by reading the story The Gingerbread Man Loose in the School by Laura Murray and enrich their experience with the...
Edmond Public Schools
8th Grade Science Resource Book: Unit 2 - Physics
Get things moving with this extensive collection of physical science resources. Covering the fundamentals of measurement, graphing, lab safety, and experimental design as well as the specific scientific concepts of velocity,...
Missouri Department of Elementary
Ingredients of a Relationship Recipe
An eye-catching hook makes a smart analogy between ingredients for a food recipe and ingredients for quality relationships. Scholars discuss and list qualities they feel contribute to positive interactions. Pupils create a recipe card...
Curated OER
Unit 0 Review - Measurement Lab Equipment
Review questions like these can be used in your biology, chemistry, physics, or earth science classes! They assess scientists' understanding of laboratory measurement tools including graduated cylinders, thermometers, and balances. They...
Curated OER
Boxplots Introduction
Students describe the pattern of a bell curve graph. In this statistics lesson, students move data around and make observation about the mean, and the quartiles. They define boxplot, outlier, range and other important vocabulary words...
Curated OER
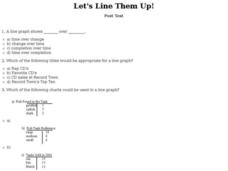
Let's Line Them Up! Post Test
In this line graphs worksheet, students answer multiple choice questions about line graphs. Students complete 10 multiple choice questions.


