Curated OER
Do You Feel Lucky?
Students calculate simple probabilities using mathematics then roll dice to test their predictions.
Curated OER
The Lake Effect
Fourth graders conduct an experiment demonstrating the effects of water and air temperature on precipitation. They create graphs demonstrating their findings using Claris Works for Kids.
Curated OER
Graph Polynomial Functions
Pupils explore a method of checking the sum or difference of polynomials by graphing the problem and the simplified answer and comparing the graphs.
Curated OER
C is for Cookie-A MEAN-ingful Graphing Activity
Third graders, in groups, dissect a variety of brands of chocolate chip cookies and calculate the mean for each brand. They create their own bar graphs, pictographs, and line graphs to represent information.
Curated OER
Quadratic Function Graph
Learnerss engage in a study of quadratic functions and how the coefficient of x^2 has on the graph of it. They study the quadratic function for review with the help of index cards. The lesson includes a resource link to align the it with...
Texas Instruments
2B or not 2B a Functions
Learners use their graphing calculators to view graphs of equations. They tell if each equations is or is not a function and are shown pre-set graphs on their graphing calculators. They use the Quick Poll feature to indicate if the graph...
Curated OER
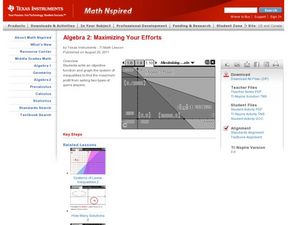
Maximizing Your Efforts
Students graph systems of equation. In this algebra instructional activity, students find where the lines cross and identify the type of solution. They analyze a graph and write the equation of the line.
Curated OER
Epsilon-Delta Window Challenge
Students graph functions and analyze them. In this calculus lesson, students define limit formally using Epsilon-Delta. They use the TI to graph the function and analyze it.
Curated OER
Geometric Sequences and Series
Learners find common ratios of geometric sequences on a spreadsheet. Using this data, they create scatter plots of the sequences to determine how each curve is related to the value of the common ratio. They will consider whether series...
Curated OER
Exploration of Trigonometry
Learners explore how changing an angle in a triangle changes the ratio of the sides. They also explore how changing the sides can make changes to an angle in a triangle. Finally, they determine how two different pairs of sides, in the...
Curated OER
Simple Inequalities on a Number Line
High schoolers solve inequalities problems. In this algebra lesson, students graph the solution of inequalities on a number line. They discuss boundaries and open or closed intervals.
Curated OER
Instantaneous Rate of Change of a Function
Pupils draw the graph of a door opening and closing over time. They graph a given function on their calculators, create a table of values and interpret the results by telling if the door is opening or closing and evaluate the average...
Curated OER
One of the Many Ways
Explore the concept of polynomials and determine the value and number of zeros for a given polynomial using the Rational Root Theorem. Then graph the polynomials and relate the number of zeroes to the degree of the polynomial.
Texas Instruments
Light and Day
Pupils explore the concept of collecting data as they collect data on their graphing calculator about time, temperature, and light. Learners plot the data and create histograms and box and whisker plots to analyze the data.
Texas Instruments
Math TODAY for TI-Navigator System - Is Leisure Time Really Shrinking?
High schoolers organize data from the USA TODAY Snapshot, "Is leisure time really shrinking?" into two scatter plots and determine the quadratic model for each scatter plot. They determine if these graphs intersect and learn the concept...
Curated OER
Shedding Light on the Weather with Relative Humidity
Learners study weather using a graphing calculator in this lesson plan. They collect data for temperature and relative humidity for every hour over a day from the newspaper, then place the data in their handheld calculator and examine it...
Curated OER
It's In The Chocolate Chips
Students investigate which brand of chocolate chip cookies contains the most chocolate. They analyze and compare data using Microsoft Word and Microsoft Excel. They communicate the results with Microsoft PowerPoint.
Curated OER
How to Make Histograms
Students collect data and plot it using a histogram. In this statistics lesson, students interpret histograms. They find the frequency, percents and density.
Curated OER
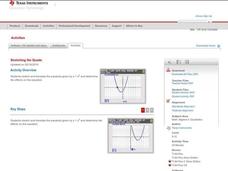
Stretching the Quads
Explore parabolas in this algebra lesson with the graphing calculator. The class investigates what effects the changing of the parameters of the vertex form of a quadrati have to its graph. They find the zeros of a quadratic graphically...
Curated OER
Rational Functions
Through a mini assessment, learners identify and list the vertical and horizontal asymptotes for the given rational functions and determine the type of asymptote of a given rational function. They also decide which form of a function...
Curated OER
Proof of Identity
Students explore trigonometric identities. In this Algebra II lesson, students use graphing to verify the reciprocal identities. Using Cabri Jr, students investigate the Pythagorean trigonometric identities and the geometric c proofs...
Curated OER
Middle Grades Math: Balancing Equations
Learners solve linear equations. By observing the graph of each side of an equation using the TI-nspire graphing calculator, your class gains insight into solutions, as well as balancing equations and transforming linear equations....
Curated OER
Watch Your P's and Q's
Using your graphing calculator, find all the rational zeroes of a polynomials by using the Rational Zero Theorem. Divide polynomials using the Remainder Theorem and the Factor Theorem and then graph it to find the number of real roots.
Curated OER
Nutria And The Disappearing Marsh
Young analysts examine changes in the nutria population, vegetation density, and marsh area over time in the wetlands of Louisiana. They import data and use the TI-73 Explorer to graph and analyze the effects of nutria on marsh loss.


