Curated OER
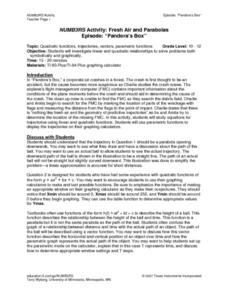
NUMB3RS Activity: Fresh Air and Parabolas
Explore parabolas and investigate linear and quadratic functions to solve problems symbolically and graphically. Also use parametric functions to display trajectories on a graphing calculator.
Curated OER
Geometry and Measurement
Young geometers explore relationships between units of measure and objects. Three activities provide varied opportunities to practice. Learners calculate the volume of two cylinders made by rolling a piece of paper vertically and...
Curated OER
Complex Numbers
The class practices, on paper and/or on a TI graphing calculator the concepts of how to add, multiply, divide and subtract complex numbers using the correct property.
Curated OER
Algebra 1: Slope as Rate
Students solve problems with slopes. In this algebra lesson, students identify the slope of a line and relate it to the rate of change. They graph their lines on the TI and observe changes in the lines.
Curated OER
Exploring Expressions
Examine parts of an expression in this algebra lesson plan. Ninth graders identify the properties of the coefficient and their behavior to the graph. They graph the equation on a TI to see their results.
Curated OER
Moo-Velous Butter!
Third graders investigate how temperature and motion (energy) create a chemical change that turns cream ( a liquid) into butter (a solid). They create a class pictograph of their favorite mils choices (white, chocolate, or strawberry)...
Curated OER
Matrix Operations
Two real-world activities to practice adding, subtracting and multiplying matrices to problem solve. Data from several Pro football quarterbacks is used in one activity to make some predictions based on their stats. Then the class takes...
Jason Learning
Tech in the Cycle
It might not be easy, but it is worth recycling electronics. Small groups determine the percentage of the materials that make up an iPad 2 and display the information in a circle graph. They then research the recycling process for...
Curated OER
Confidence Levels
Learners collect data and graph it. In this statistics lesson, students rate confidence levels by collecting data and analyzing it. They graph their findings on the Ti calculator.
Curated OER
Finding a Line of Best Fit
Pupils engage in the practice of creating a scatter plot with the data obtained from measuring different resting heart rates. The data is used to create the table that is translated into a graph. The lesson gives instructions for the use...
Curated OER
Dynagraphs
Students collect and graph their data. In this precalculus lesson, students identify the input and out of a function. They find the domain and range and the inverse of a function.
Curated OER
Simple Harmonic Motion
Students solve problems involving graphs. In this calculus lesson, students relate harmonic motion to velocity. They discuss the derivative and the effect on the functions created.
Curated OER
Drawing a Triangle with Cabri Junior
Learners draw triangles on their graphing calculators using the Cabri Junior application. In this graphing calculator lesson, students follow step by step directions to create triangles on their calculator. They identify the type of...
Curated OER
Phonics Test #17: Annie's Song
In this sounds worksheet, students find words that have the same sound as the underlined sound in the first word from the story Annie's Song. Students complete 10 multiple choice questions.
Curated OER
Mining Reclamation and Cookies
Ninth graders are introduced to the process of mining. In groups, they use the internet to research the effect of mining on the environment. They work together to create their own make believe mining company and discover the process of...
Curated OER
Chocolate Chip Cookie Mining Worksheet
In this coal mining math worksheet, students perform a set of operations to determine profit of mining a "chocolate chip cookie" and graph results.
Curated OER
Quarter Coin Cookies
Young scholars study the historical figures and symbols of U.S.
patriotism depicted on the penny, nickel, dime, and quarter coins. They explore the processes involved in making coins, and how metals canchange in consistency from the...
Curated OER
Find Minimum and Maximum
Learners engage in a lesson about finding the values of different graphs written in the vertex form. They rewrite each quadratic equation in vertex form while graphing the equation with the visual display of a parabola that matches the...
Curated OER
Using Symmetry to Find the Vertex of a Parabola
Learners engage in a lesson that is about finding the vertex of a parabola while using symmetry. They use the symmetry to find out where the two lines meet. The line is displayed with the help of a graphing calculator. The lesson...
Curated OER
Solids and Water
Students investigate mixtures made of water and familiar solid materials. They observe and discuss the changes that occur immediately and set the mixtures aside for a day. Finally, students observe the mixtures, note changes, and graph...
Curated OER
Cause and Effect
Third graders investigate cause and effect. In this cause and effect lesson, 3rd graders read a story and determine what are the causes and effects. Students match sentence strips to the make the correct cause and effect sentence....
Curated OER
Food Fit For An Ant
In this science worksheet, students observe an ant hill located by the school. Students place a plate with different types of foods near the anthill. Students observe and record what they see. Students graph the foods according to how...
Curated OER
Two-Variable Linear Inequalities
Here is an engaging instructional activity on solving equations with two variables. Have the class rewrite linear equations in the slope intercept form, y=mx + b. They graph the lines using the slope and y-intercepts.
Curated OER
Exploring Circles
Students explore circles using a graphing calculator. For this circles lesson, students write the equation of a circle with a given center and radius length. Students find the most appropriate model for each combination of data they...


